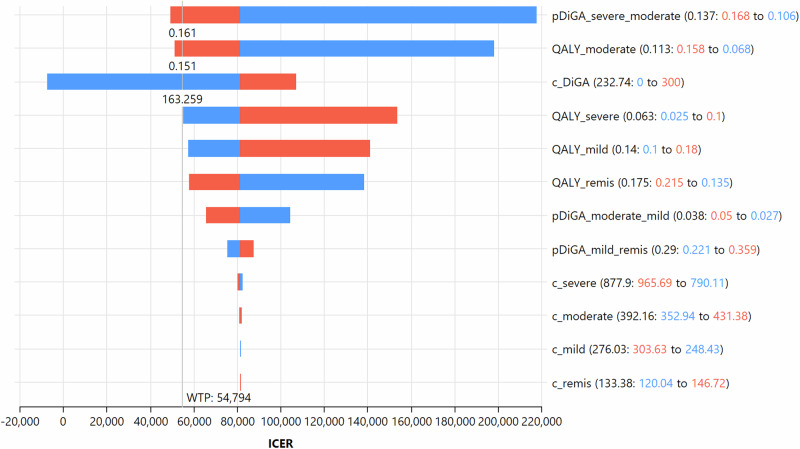
Fig. 3. Tornado diagram of one-way sensitivity analysis assessing the effect of selected parameters on the ICER.
ICER = Incremental cost effectiveness ratio, WTP = willingness-to-pay ratio referred to quality-adjusted life years; the horizontal bars represent the range of ICER due to changes in the model’s input parameters for one average patient in the cohort. Codification in the legend according to the following scheme: Input variable name (base case value: upper/lower range to lower/upper range), red = upper range of the input variable variation; blue = lower range of the input variable variation. p_DiGA_severe_moderate = transition probability to move from severe to moderate depression health state with use of DiGA; QALY_moderate = quarterly quality adjusted life years of an average patient in moderate depression health state; c_DiGA = quarterly cost of using a DiGA; QALY_severe = quarterly quality adjusted life years of an average patient in severe depression health state; QALY_mild = quarterly quality adjusted life years of an average patient in mild depression health state; QALY_remis = quarterly quality adjusted life years of an average patient in remission health state; pDiGA_moderate_mild = transition probability to move from moderate to mild depression health state with use of DiGA; pDiGA_mild_remis = transition probability to move from mild depression to remission health state with use of DiGA; c_severe = quarterly total direct costs of an average patient in severe depression health state; c_moderate = quarterly total direct costs of an average patient in moderate depression health state; c_mild = quarterly total direct costs of an average patient in mild depression health state; c_remis = quarterly total direct costs of an average patient in remission health state.

