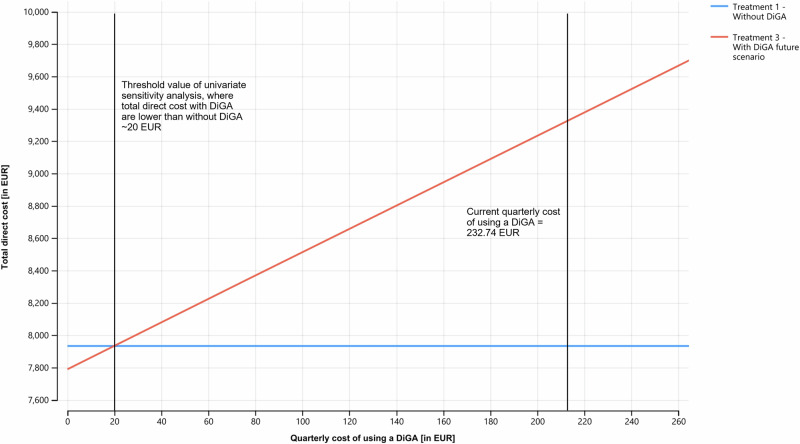
Fig. 4. Extended univariate sensitivity analysis of input variable quarterly cost of using a DiGA.
The graph shows the comparison of total direct costs of treatment scenario 1 and treatment scenario 3 depending on the quarterly cost of using a DiGA. The analysis shows that once the quarterly cost of using a DiGA fall below the threshold of ~20 EUR, the total direct costs of scenario 3 are lower compared to scenario 1. Blue line = Treatment 1 without DiGA; red line = Treatment 3 with DiGA future scenario.

