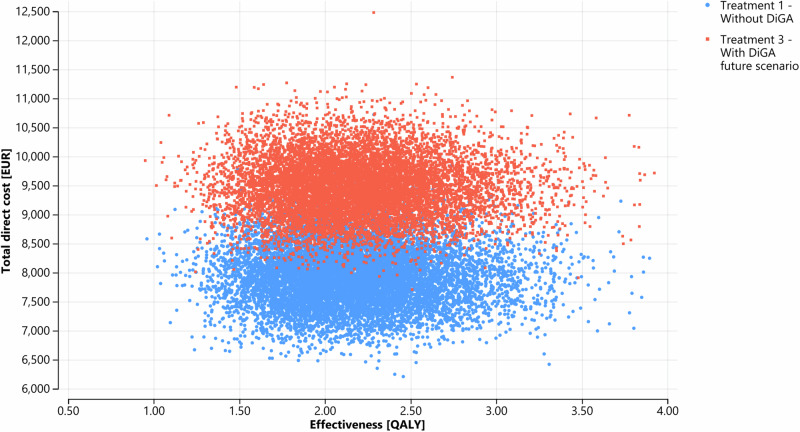
Fig. 5. Probabilistic sensitivity analysis (PSA).
Each data point marks the result of one of the 10,000 simulation runs, where input parameters were randomly drawn from defined distributions according to Table 2 to assess parameter uncertainty. DiGA treatment gained average QALYs of 2.19 (95% CI; 2.18–2.20 QALY) with mean total direct costs of ~ 9476 EUR (95% CI; 9466–9486 EUR) per patient in the cohort; compared to the treatment without DiGA with average QALYs of 2.17 (95% CI; 2.16–2.18 QALY) with mean total direct costs of ~7936 EUR (95% CI; 7926–7946 EUR) per patient in the cohort. Blue dots = Treatment 1 without DiGA; red dots = Treatment 3 with DiGA future scenario.

