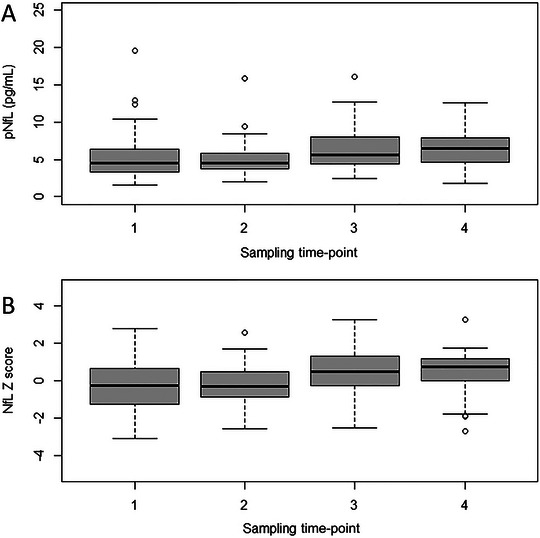
FIGURE 2.

Longitudinal plasma NfL levels and NfL Z scores in subjects before and after altitude exposure. The X‐axis depicts the different sampling time‐points; sampling time‐points 1 and 2 before and after study Cycle 1, sampling time‐points 3 and 4 before and after study Cycle 2. NfL = neurofilament light.
