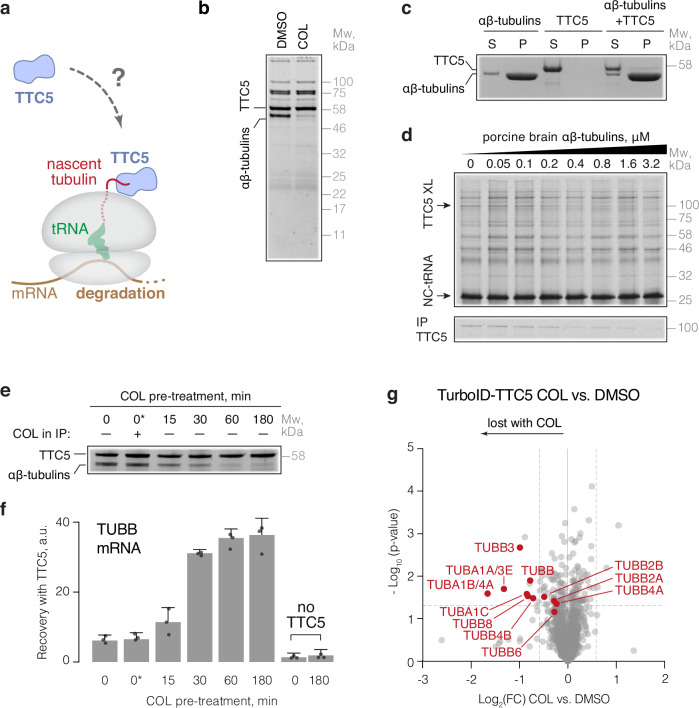
Fig. 1. Soluble αβ-tubulins reversibly repress TTC5 to regulate its activity.
a The tubulin autoregulation pathway. b Recombinant Strep-tagged TTC5 was mixed with lysate from untreated or colchicine-treated (COL, 3 h) TTC5 knockout HEK293 cells and recovered by affinity purification via the Strep-tag. The sole differential interaction partner was a mixture of αβ-tubulins. Depicted is a representative blot from three independent experiments. c Binding of TTC5 to microtubules was analyzed by microtubule co-pelleting assay. Representative blot from three independent replicates is shown. TTC5 mostly remains in the soluble fraction (S), while microtubules are mostly in the pellet (P). d Nascent β-tubulin crosslinking assay in the presence of the indicated concentrations of soluble porcine brain αβ-tubulins. The TTC5 crosslink is indicated and verified by immunoprecipitation (bottom panel). The 94-residue β-tubulin nascent chain was produced in rabbit reticulocyte lysate in the presence of 35S-methionine and the UV-activated cross-linking amino acid p-benzoyl-L-phenylalanine (Bpa) was incorporated at position 7 by amber suppression. Ribosome-nascent chain complexes were isolated and incubated with porcine brain tubulin and cross-linked under UV light. Reactions were immuno-precipitated with anti-TTC5 antibody or analyzed by SDS-PAGE and autoradiography. Shown is a representative blot from three independent replicates. e TTC5 knockout HEK293 cells were pre-treated for the indicated times with colchicine, and then lysed. One aliquot of each lysate was used for binding analysis to recombinant Strep-TTC5 as in (b). One control sample included colchicine added after cell lysis (indicated as 0*). Depicted is a representative blot from three independent replicates. f The products coimmunoprecipitated with recombinant TTC5 in panel (e) were analyzed for α- (Fig. S1i) and β-tubulin mRNAs by quantitative RT-PCR (mean ± SD from three independent replicates) and normalized to a reference transcript (RPLP1). g Proximity labeling using TurboID fused to TTC5 and expressed in TTC5 knockout HEK293 cells, followed by enrichment of biotinylated proteins and quantitative mass spectrometry. Data from cells treated with colchicine were normalized to DMSO control and plotted as Log2 fold-change (Log2(FC)). Dashed lines represent a threshold of 1.5-fold change and 0.05 p-value. Annotated are different tubulin isoforms. Processed data are provided in Supplementary Data 1. Source data for this figure are provided as a Source Data file.

