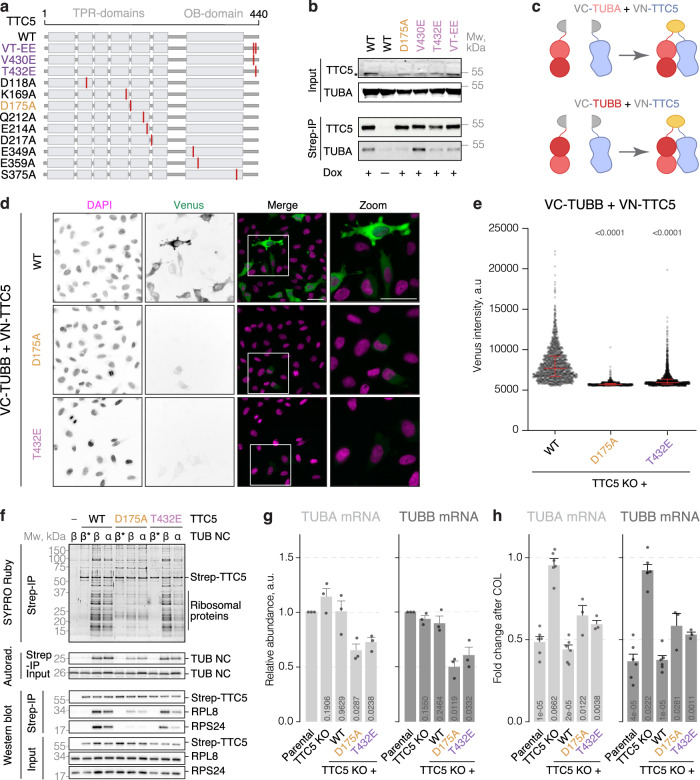
Fig. 3. Loss of binding to αβ-tubulins constitutively activates TTC5.
a Generated TTC5 constructs. b Indicated Strep-TTC5 constructs were expressed in HeLa TTC5 knockout cells and pulled down via Strep-tag. Bound αβ-tubulins were visualized by western blot. The asterisk indicates Strep-TTC5. The experiment was repeated three times with similar results. c BiFC approach. d Representative images of the indicated constructs expressed in HeLa TTC5 knockout cells. Scale bar = 20 µm. e Fluorescence intensity of Venus across the indicated BiFC cell lines. Red lines depict median and interquartile fluorescence intensities. Indicated are p-values in the two-sided Mann–Whitney test for each of the BiFC constructs with the one based on TTC5WT as reference. The experiment was done with six biological replicates, analyzing 6465, 2005, and 5258 cells for WT, D175A, and T432E samples, respectively. f Sixty-four-residue α- and β-tubulin nascent chains (TUB NC) were produced in rabbit reticulocyte lysates in the presence of 35S-methionine and recombinant WT or mutated Strep-TTC5. Strep-TTC5 and its associated proteins were subsequently enriched via the Strep-tag. Interacting partners were visualized by SYPRO Ruby staining, western blot, and autoradiography. β* indicates a β-tubulin construct in which its TTC5-interacting MREI motif has been mutated to autoregulation-incompatible MHQV. Data shown is representative of two replicate experiments for the D175A mutant, and from one experiment for the T432E mutant. Results were confirmed by orthogonal means (Fig. 3h). g Relative α- and β-tubulin mRNA levels in HeLa parental, TTC5 knockout, and the indicated Strep-TTC5 cell lines, normalized to a housekeeping transcript and the parental cell line. Data show the mean ± SD from three independent experiments. Indicated are p-values in unpaired, two-tailed Student’s t-tests for each of the indicated cell lines with the parental cell line as reference. h Autoregulation assay with HeLa parental, TTC5 knockout, and the indicated Strep-TTC5 cell lines. Data show the mean ± SD mRNA levels from three (D175A and T432E) and six (Parental, TTC5 KO and WT) independent experiments. Indicated are p-values in unpaired, two-tailed Student’s t-tests for each of the indicated cell lines with the DMSO-treated sample as reference. Source data for this figure are provided as a Source Data file.

