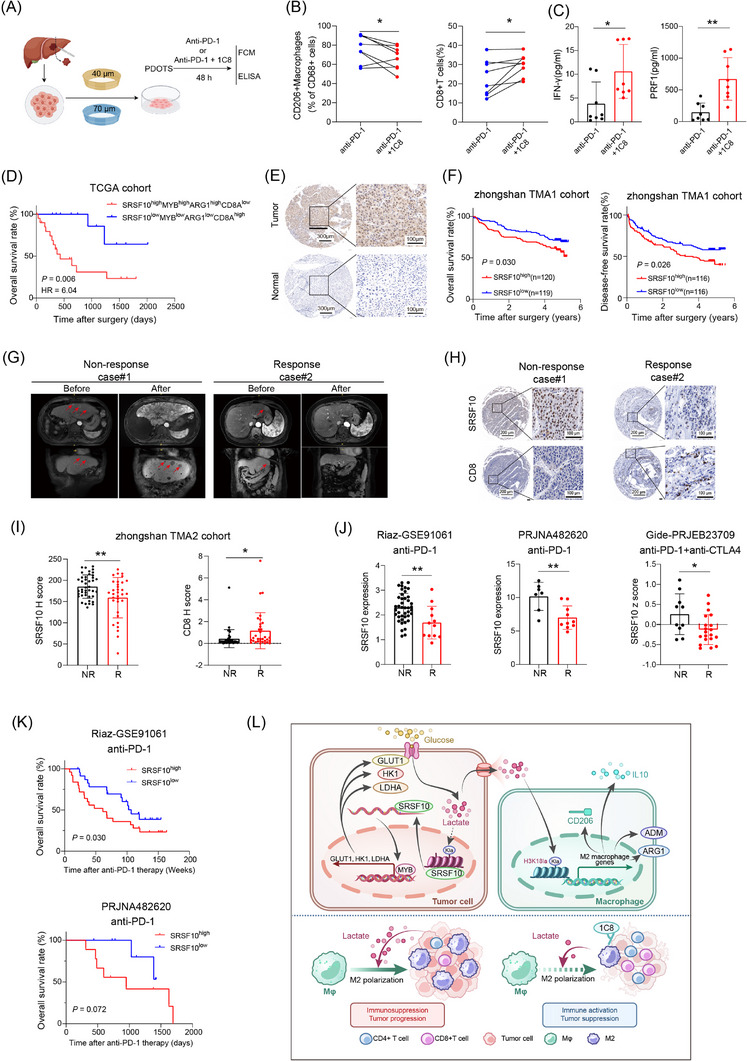
FIGURE 7.

SRSF10 was associated with immunotherapy resistance and poor prognosis. (A) Schematic of PDOTS experiment. (B) Percentages of tumor‐infiltrating CD206+ macrophages and CD8+ T cells from PDOTS. (C) Secreted IFN‐γ and PRF1 in the supernatants of PDOTS detected by ELISA. (D) Kaplan–Meier curves for OS of patients with HCC from TCGA‐LIHC cohort. (E) Representative images of IHC staining for SRSF10 of HCC tissue and adjacent normal tissue. (F) Kaplan–Meier curves for OS and Disease‐free survival (DFS) of patients with HCC. (G) Magnetic resonance imaging scans of a responder (patient 1) and non‐responder (patient 2) to PD‐1 mAbs before and after treatment. (H) Representative images of IHC staining for SRSF10 and CD8 of two patients with HCC. (I) The expression of SRSF10 and CD8 in response patients and non‐response patients of Zhongshan TMA2 cohort. (J) Bulk RNA‐seq data revealed that responders had high expression of SRSF10 in publicly available datasets. (K) The prognostic prediction performances of SRSF10 for OS were assessed by Kaplan‐Meier curve analysis using a melanoma cohort and GBM cancer cohort. (L) Illustration of the proposed working model. Two‐tailed Paried Student's t test (B); two‐tailed unpaired Student's t test (C, I‐J); Log Rank test (D, F); Gehan‐Breslow‐Wilcoxon test (L); ns, not significant; * P < 0.05, ** P < 0.01, *** P < 0.001. Abbreviations: PDOTS, Patient‐derived organotypic tumor spheroids; FCM, flow cytometry; ELISA, enzyme‐linked immunosorbent assay; PD‐1, programmed cell death 1; SRSF10, serine and arginine rich splicing factor 10; OS, overall survival; DFS, Disease‐free survival; IFN‐γ, Interferon gamma; PRF1, perforin 1; TCGA, The Cancer Genome Atlas; LIHC, Liver hepatocellular carcinoma; IHC, immunohistochemistry; TMA, tissue microarray; GBM, Glioblastoma multiforme.
