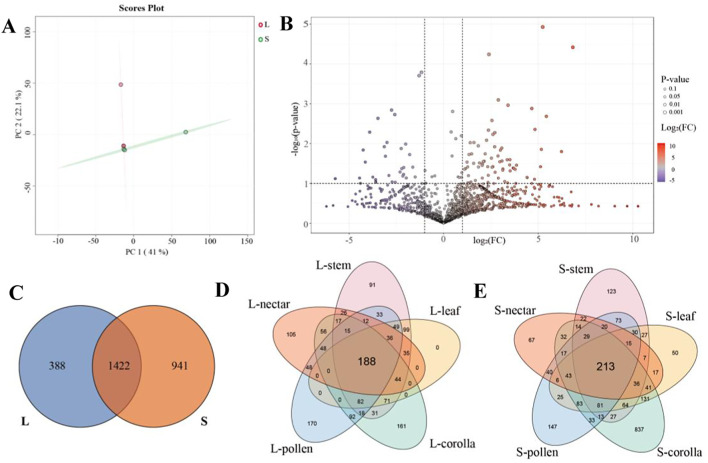
Figure 6.
Differential analysis of secondary metabolites in O. alatiflora. (A) PCA analysis of secondary metabolites in L-morph and S-morph plants; (B) Volcano plot of secondary metabolite analysis in L-morph compared to S-morph, with purple representing downregulation and red representing upregulation; (C) Analysis of secondary metabolites shared by L-morph and S-morph; (D) Analysis of secondary metabolites shared by different tissues of L-morph plants; (E) Analysis of secondary metabolites shared by different tissues of S-morph plants.

