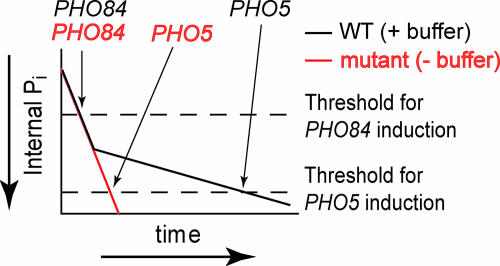
Fig. 5.
Model of gene induction in response to phosphate starvation. Schematic diagram of decreasing internal phosphate levels (in arbitrary units) for cells with (WT, black line) and without polyP (mutant, red line) after phosphate starvation (time, in arbitrary units). Once intracellular phosphate decreases below the threshold for gene induction (dashed lines), induction occurs. Arrows indicate relative timing for the onset of PHO84 and PHO5 expression in each strain. In cells containing polyP, buffer utilization sustains phosphate levels longer, delaying PHO5 induction.

