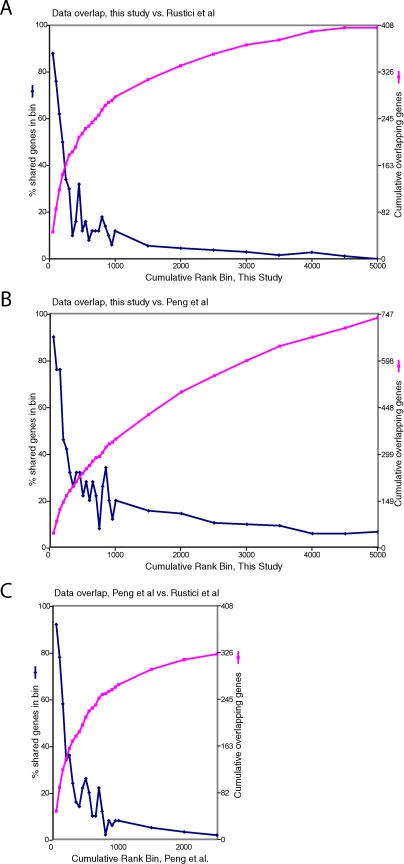
Figure 5. Overlap between Different Cell Cycle Microarray Studies, by Rank.
(A) Our ranked list of cell cycle–regulated genes is divided into consecutive sets, or bins, of 50 genes. For each set of 50 genes, the number of genes in that set also found in the list of 407 cell cycle genes of Rustici et al. [7] is plotted on the left y-axis. For instance, of our best 50 genes, 44 (88%) are found in the list of of 407 genes of Rustici et al., and of our next-best 50 genes, 38 (76%) are also in their list. For the top 15 bins (750 genes), every bin of 50 genes is represented. Afterward, the number plotted represents an average over several bins. The cumulative number of genes in the list of 407 is plotted on the right y-axis.
(B) As (A), but the bins in our study are compared to the list of 747 genes of Peng et al. [8].
(C) As (A), but the ranked list of Peng et al. is divided into bins, and compared to the list of 407 of Rustici et al. Because Peng et al. ranked only their top 2,700 genes, the graph is truncated after gene 2,700, and the cumulative number of genes rises to only 325.

