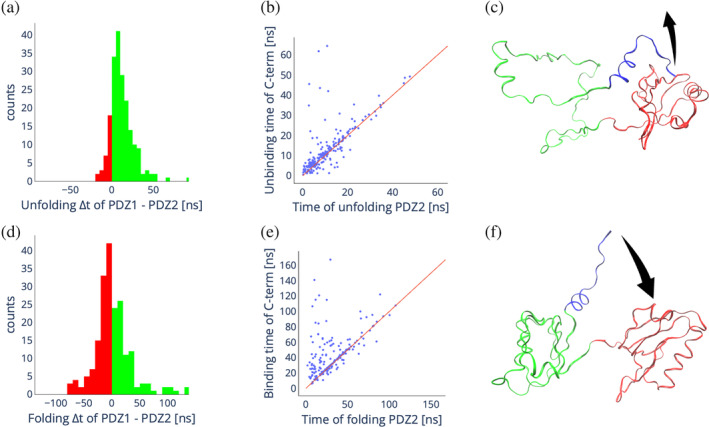
FIGURE 5.

In silico unfolding and folding of X11 PDZ1‐PDZ. (a) Distribution of the difference in unfolding times of PDZ2 and PDZ1 from 200 unfolding simulations. Green bars indicate positive differences, meaning PDZ1 unfolds slower than PDZ2, red bars indicate negative differences, meaning PDZ2 unfolds slower than PDZ1. (b) Scatter plot showing the correlation between the unfolding time of PDZ2 and the unbinding time of the C‐terminal auto‐inhibitory tail of PDZ1. (c) Schematic of the most common unfolding pathway. (d) Distribution of the difference in folding times of PDZ2 and PDZ1 from 200 folding simulations. Green bars indicate positive differences, meaning PDZ1 folds slower than PDZ2, red bars indicate negative differences, meaning PDZ2 folds slower than PDZ1. (e) Scatter plot showing the correlation between the folding time of PDZ2 and the binding time of the auto‐inhibitory tail to PDZ1. (f) Schematic of the most common folding pathway.
