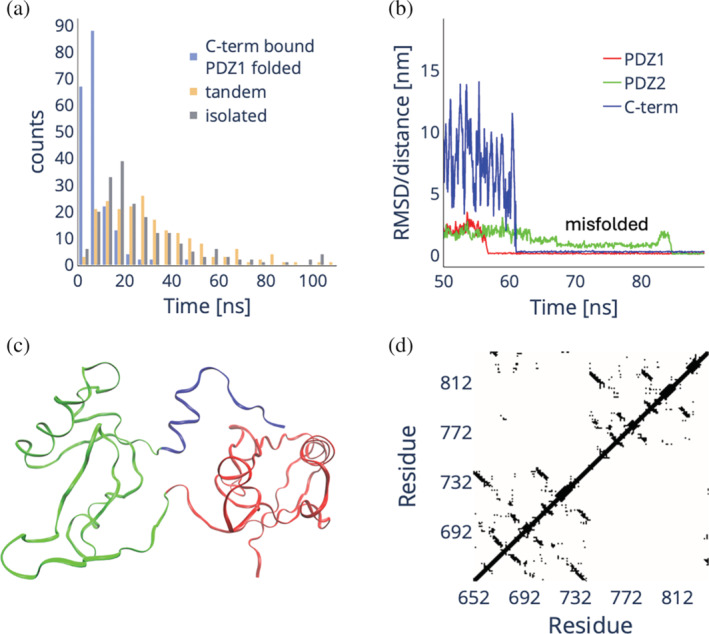
FIGURE 6.

(a) Distribution of folding times of PDZ2 when in tandem with PDZ1 with the C‐terminal auto‐inhibitory tail already bound to the folded PDZ1 domain (blue), when in tandem with PDZ1 both fully denatured (lime), and when isolated (red). (b) Representative RMSD (PDZ1 and PDZ2) and distance (C‐terminal auto‐inhibitory tail) plot for a folding simulation of X11 PDZ1‐PDZ2, representing the case where the C‐terminal auto‐inhibitory tail (blue line) binds to a folded PDZ1 domain (red line) before the folding of the PDZ2 domain (green line). In this case, a misfolded intermediate is populated that must be unfolded prior to final folding. (c, d) Cartoon and contact map representation of the misfolded state. The top diagonal contact map represents the folded X11 PDZ1‐PDZ2, while the bottom diagonal represents the misfolded conformation.
