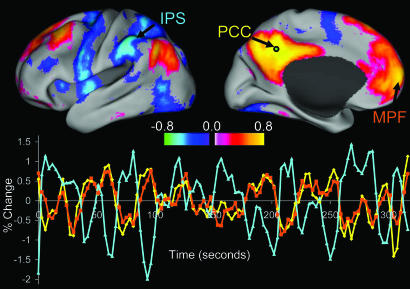
Fig. 1.
Intrinsic correlations between a seed region in the PCC and all other voxels in the brain for a single subject during resting fixation. The spatial distribution of correlation coefficients shows both correlations (positive values) and anticorrelations (negative values), thresholded at R = 0.3. The time course for a single run is shown for the seed region (PCC, yellow), a region positively correlated with this seed region in the MPF (orange), and a region negatively correlated with the seed region in the IPS (blue).

