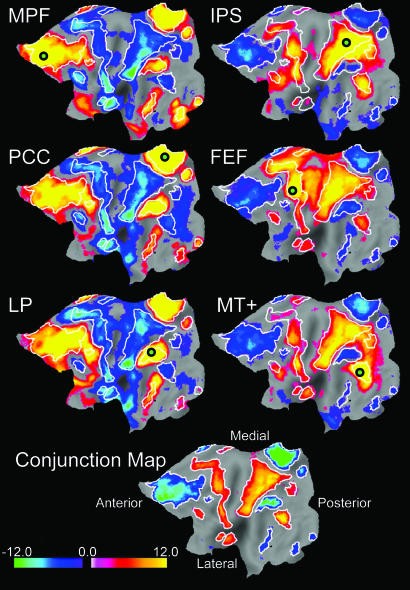
Fig. 2.
Population-based z-score maps showing nodes significantly correlated or anticorrelated with six seed regions (small circles). (Upper) (Left) Results from three task-negative seed regions: MPF, PCC, and LP. (Right) Results from three task-positive seed regions: IPS, FEF, and MT+. (Lower) The conjunction map is an average, including only nodes significantly correlated or anticorrelated with five of the six seed regions. White contours are drawn on the conjunction map and copied onto the other maps to facilitate comparison.

