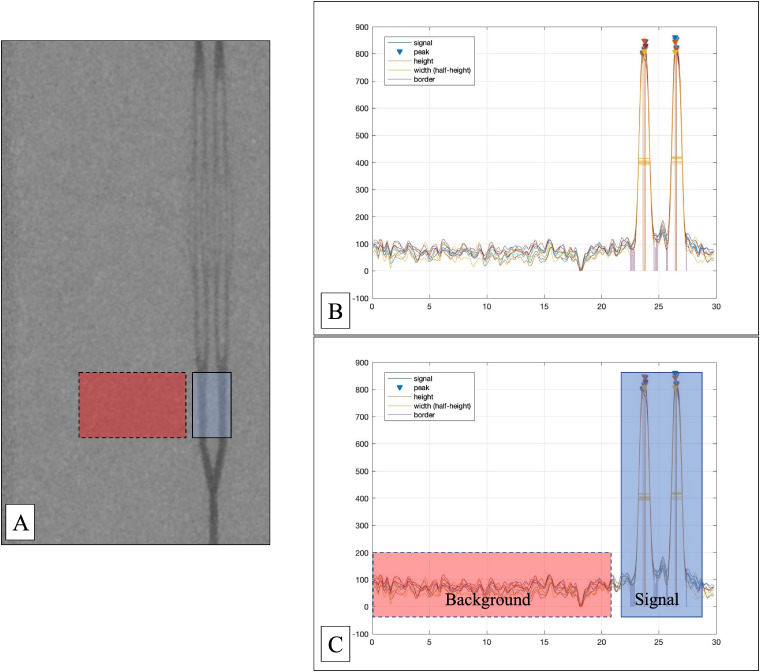
Figure 2.
(A) Still image from the injection under road map. A still image from the injection under road map shows the model with the adjacent background. The blue region indicates where the signal CNR was obtained for the 1000 micron tubes, whereas the red region indicates where the background noise measures were obtained. (B) Pixel data analysis. This graph demonstrates the Matlab findpeak function used to analyze the cine run from an injection. It shows the multiple different pixel data extracted from the same cine run. Two separate peaks are shown, in this case, for the two separate 1000 micron tubes. (C) Regions of signal and background noise extraction. The blue region with solid outline here indicates the region used to extract the signal. The red region with dashed outline was used to extract the background noise. This corresponds to the same regions seen on (A).
CNR: contrast to noise ratio.

