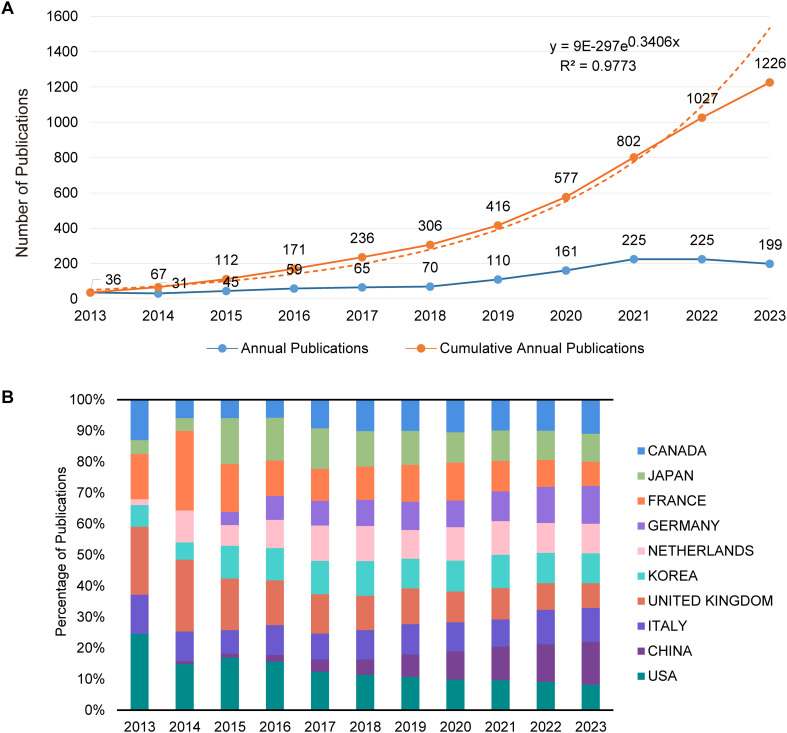
Figure 2.
Analysis of publication trends and distribution. (A) Trends in annual and cumulative annual growth in publications: This graph displays two trends: the annual number of publications and the cumulative total over time from 2013 to 2023. The annual trend line illustrates the number of publications yearly, showing fluctuations and growth patterns. The cumulative trend line, overlaid on the same graph, reflects the total number of publications accruing over the specified period, providing a visual representation of overall growth in the field. (B) Percentage of annual publications in top 10 countries: This bar chart represents the distribution of publications by the top 10 contributing countries each year from 2013 to 2023. It highlights the percentage share of each country’s publications relative to the total annual output, showing shifts in the research landscape and indicating which countries are leading or increasing their contributions over time.

