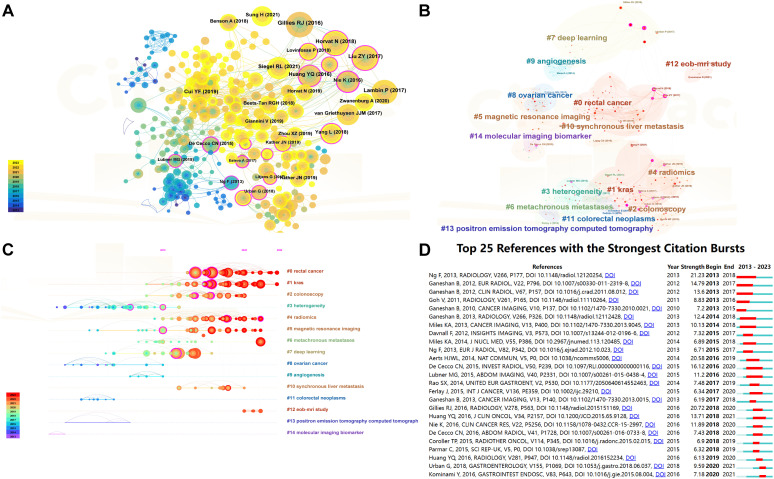
Figure 6.
Visualization of reference co -citation and citation dynamics. (A) Reference co-citation visualization: This graph displays a network of how often references are cited together within the literature, illustrating the interconnectedness of studies based on shared citations. Nodes represent individual studies, and the lines between them indicate a co-citation relationship. The size of each node reflects the frequency of co-citations, highlighting references that commonly appear together in the literature and suggesting their thematic or methodological similarities. (B) Reference co-citation clustering visualization : This visualization segments the co-citation network into clusters, each representing a group of studies that are frequently cited together, suggesting they pertain to related topics or methodologies. Different colors are used to distinguish each cluster, aiding in the visual discrimination of thematic groups within the broader research landscape. (C) Timeline plot of reference co-citation clustering: This timeline graph plots the clusters of co-cited references over time, showing the evolution of research themes and the emergence of new trends. Each cluster is plotted against the year to demonstrate when certain topics gained prominence or faded in relevance, providing insights into the historical and developmental trajectory of research in the field. (D) Top 20 references with the highest citation explosion rate: This graph identifies the top 20 references that have experienced the most significant surges in citations over a specific period, indicating their rising influence or foundational impact on current research. Each reference is represented by a bar, the length of which corresponds to the “explosion” rate of citations, and color-coded to indicate the duration of the citation surge.

