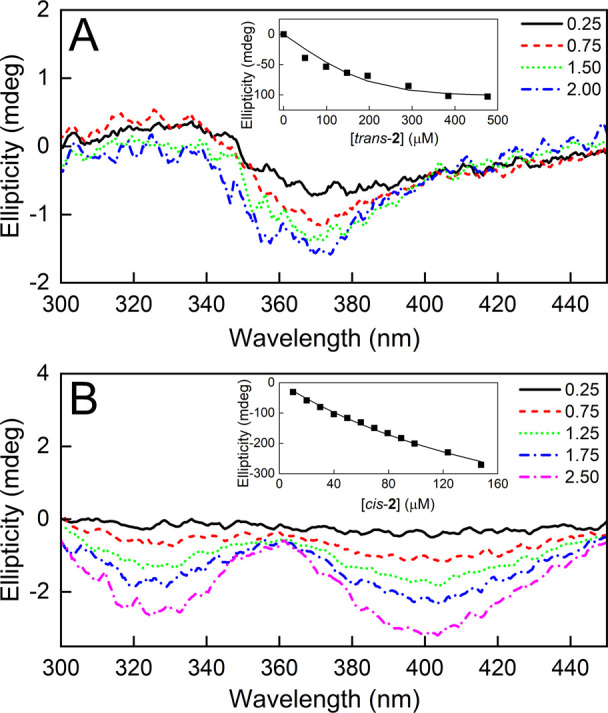
Figure 12.

CD spectra of BSA complexes with trans-2 (A) and cis-2 (B). Measurements were done in PBS pH 7.4 at 25 °C. Numbers shown in the legends indicate the molar excess of 2 relative to BSA. Insets: exemplary dependence of the CD signal intensity relative to 2 concentration. Solid lines represent the best fit of the measurement data to the single-site binding model.
