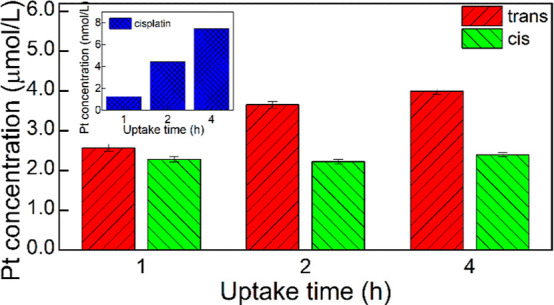
Figure 9.

Pt concentration in the lysates of 4T1 cells incubated for various times with trans-2, cis-2, and cisplatin. Since the Pt concentration in the lysates of cells exposed to cisplatin was 3 orders of magnitude lower than in cells exposed to either of the complex photoisomers, the cisplatin bars would be not visible on the common Y-scale; therefore, the data for cisplatin are shown in the inset.
