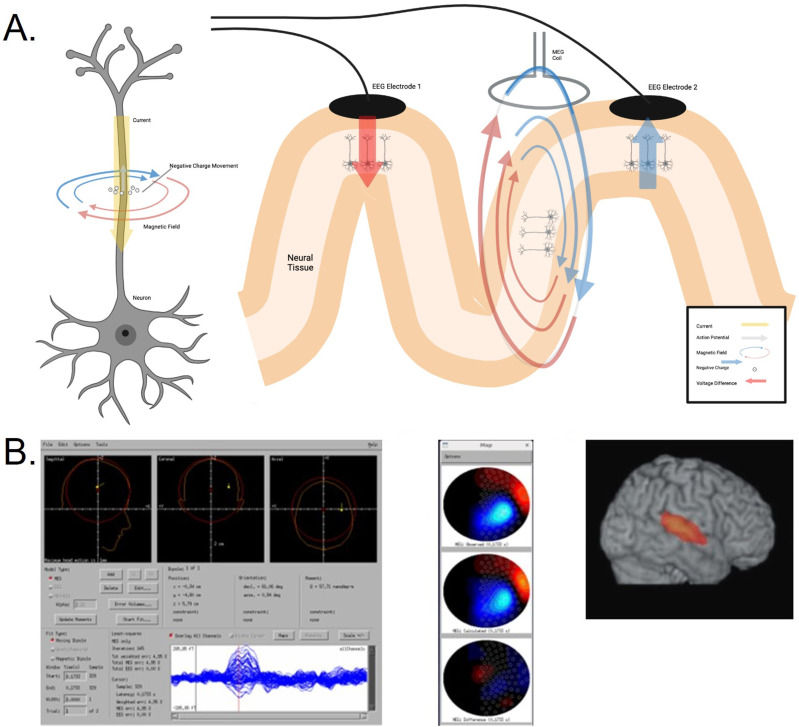
Figure 1.
Electrophysiological basis of MEG signals and example of dipole and beamformer source localization results. (a) Shows an action potential generated from a neuron along with a corresponding electric and magnetic field that are produced by the movement of negative charge along the outer membrane of the axon. A magnified simplified view of the measurement of electric (post-synaptic potentials) and magnetic (intracellular current) fields generated. The two EEG electrodes measure the difference in voltage from two groups of neurons along the neuronal axon, while the MEG coil measures unreferenced magnetic flux produced tangentially from a single group of neurons. This can lead to differences in field strength between MEG and EEG in both gyri and sulci, for this type of activity. Figure created using BioRender software. (b) Example of CTF’s dipole source algorithm interface. The observed waveform with overlaid sensors can be seen at the bottom, with the red vertical line indicating the selected time point. The top three views show the computed dipole location. Information regarding the exact time point, goodness-of-fit/error, and dipole coordinates are also provided. Topographic maps looking down on the head with the plot for the acquired data at the top, the reconstructed data from the forward solution in the middle, and the difference at the bottom. Example of the source localization applied using a beamforming algorithm.

