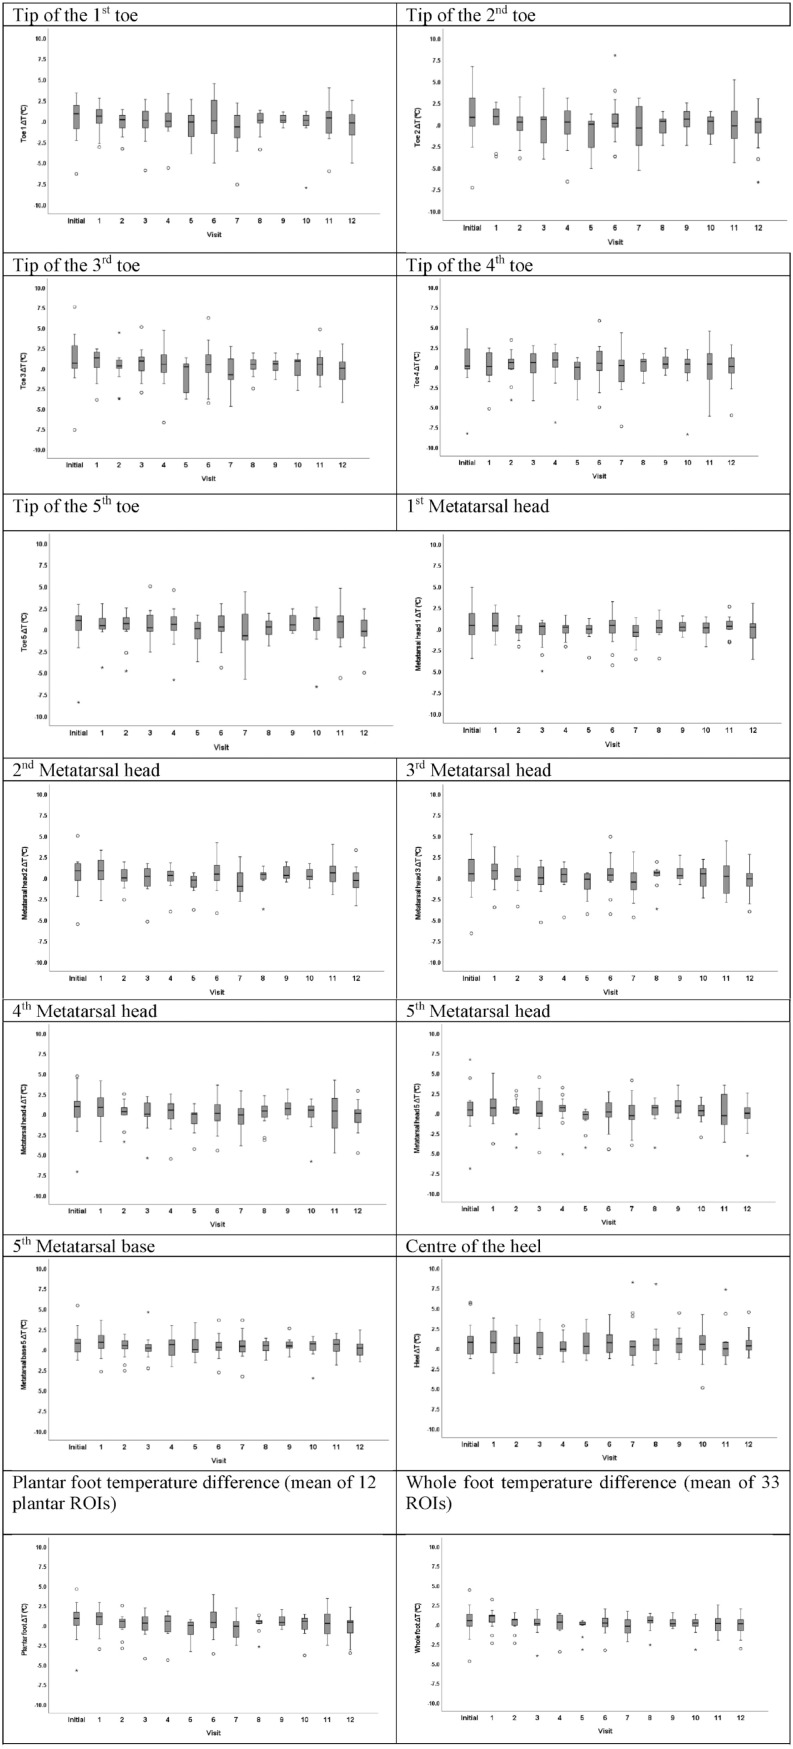
Figure 2.
Thermal imaging data of people living with diabetes at the initial and the subsequent 12-monthly follow-up visits.
Data are presented as box and whiskers plots indicating the median temperature difference for the overall study sample and the 25th and 75th percentile at the initial visit and at the 12-monthly consecutive study visits at each plantar ROI, for the plantar foot, and for the whole foot. A total of 169 imaging sequences including plantar, dorsal, medial, and lateral views were analyzed. The number of participants who were assessed at each visit was as follows: Initial visit = 15 participants; month 1 = 13 participants; month 2 = 13 participants; month 3 = 13 participants; month 4 = 13 participants; month 5 = 12 participants; month 6 = 14 participants; month 7 = 13 participants; month 8 = 11 participants; month 9 = 12 participants; month 10 = 13 participants; month 11 = 12 participants; month 12 = 15 participants.

