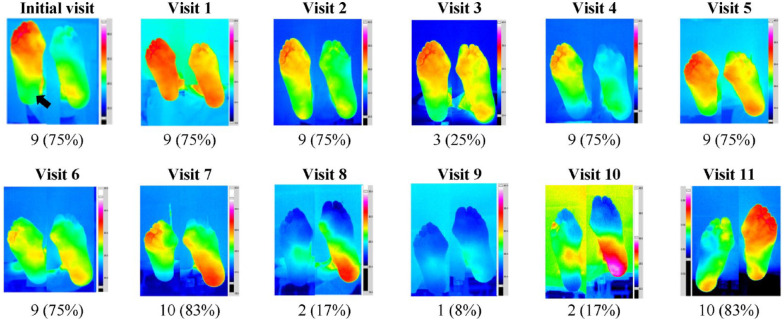
Figure 3.
Representative example of between-visit variability of monthly plantar thermal images.
Consecutive plantar thermal images of the right and left foot in a person with diabetes and a history of a healed DFU of the right heel (black arrow, initial visit). At the end of the study, the thermal images were unblended, and the ∆Ts of 12 plantar ROIs were calculated. At each visit, the number (%) of ROIs with ∆T ≥ 2.2°C is presented. There was a substantial between-visit variability in the appearances of the thermograms of both feet. Overall, 82 of 144 plantar ROIs exceeded the 2.2°C threshold (range 1-10 ROIs with ∆Ts ≥ 2.2°C per visit). The feet remained intact, and none of these hotspots progressed to the development of a DFU.

