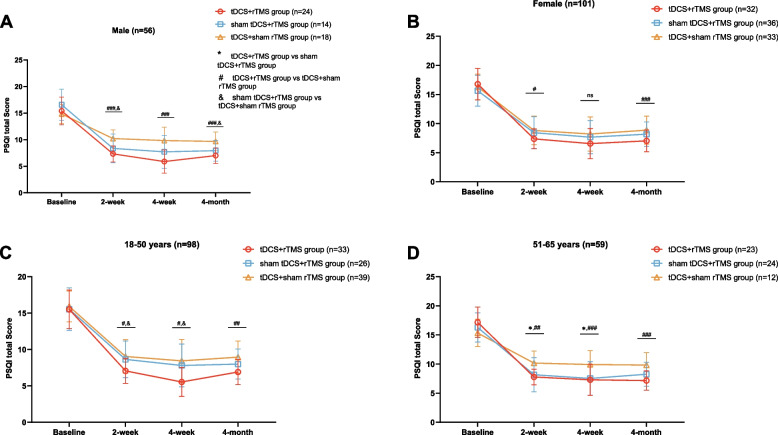
Fig. 2.
Repeated-measures analysis of variance and post hoc tests comparing PSQI scores at 2 weeks, 4 weeks, and 3 months after treatment for different neuromodulation groups stratified by gender (A, B) and age (C, D). * P < 0.05, ** P < 0.01, *** P < 0.001, tDCS + rTMS group vs sham tDCS + rTMS group; # P < 0.05, ## P < 0.01, ### P < 0.001, tDCS + rTMS group vs tDCS + sham rTMS group; & P < 0.05, && P < 0.01, &&& P < 0.001, sham tDCS + rTMS group vs tDCS + sham rTMS group; ns, no significant difference. PSQI, Pittsburgh Sleep Quality Index

