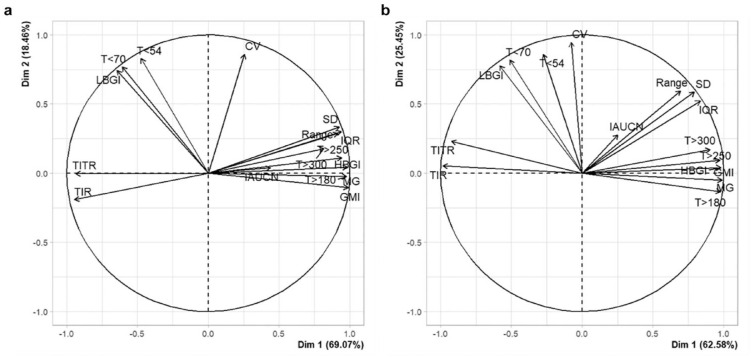
Figure 3.
The PCA for the 16 CGM metrics in the two different DR groups (control group (a); vs DR group (b)). The black vectors represent the coordinates of each metric (ie, loadings multiplied by the component standard deviations). On dimension 1 (dim 1), metrics have large positive loadings, such as MG, T>180, and T>250. On dimension 2 (dim 2), metrics have large positive loadings such as low blood glucose index (LBGI), T<54, and T<70. Positively correlated metrics point to the same side of the graph.
Abbreviations: PCA, principal component analysis CGM, continuous glucose monitoring; DR, diabetic retinopathy.

