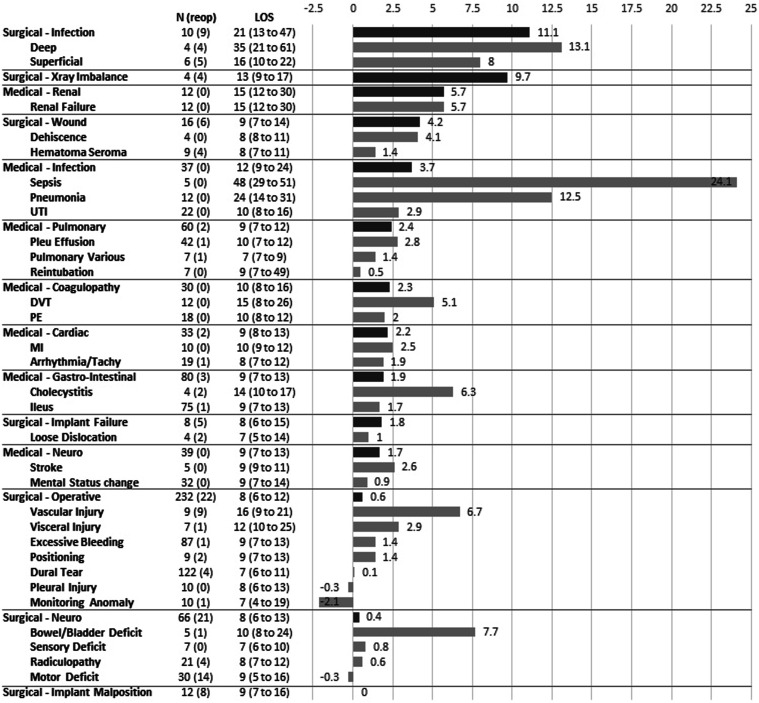
Figure 3.
Incidence, rate of reoperation (reop), median length of stay (LOS) and interquartile range (25th and 75th quartile) reported by type and sub-type of complications. Bargraph represent the median Incremental effect of complication on LOS by classes of complications as calculated by a multilayered neural network model. For clarity, only complications with at least an incidence of 4 were reported in this table.

