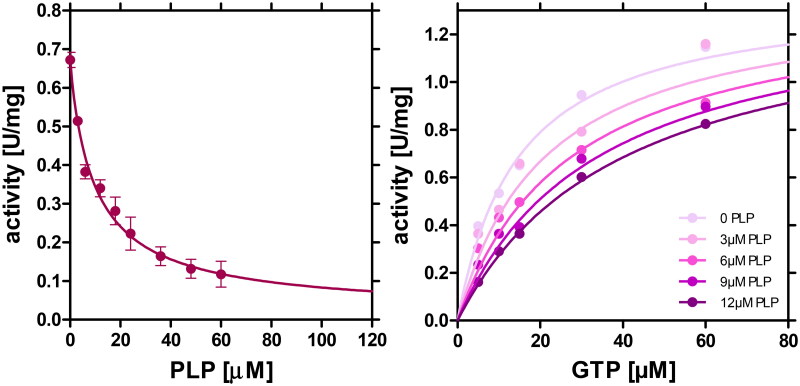
Figure 2.
Left panel: Inhibition of H. pylori AdSS by PLP at 25 °C in 20 mM Hepes buffer at pH 7.7, 1 mM MgSO4, at saturating concentrations of AdSS substrates, IMP (0.15 mM), GTP (0.06 mM) and Asp (5 mM). The four-parameter dose-response curve (Equation (1)) was fitted to the data, yielding IC50 = 9.97 (with asymmetric confidence intervals 3.99 to 24.91 µM). Right panel: Inhibition of H. pylori AdSS by PLP at 25 °C in 20 mM Tris buffer at pH 7.7, 1 mM MgSO4, at saturating concentrations of IMP (0.15 mM) and Asp (5 mM), and variable concentration of GTP. Increasing PLP concentrations, 0, 3, 6, 9 and 12 µM, respectively, are shown by increasing the colour intensity of the points of individual data series. Competitive inhibition model was fitted globally to all data points, and yielded Ki = 6.95 ± 0.82 µM.

