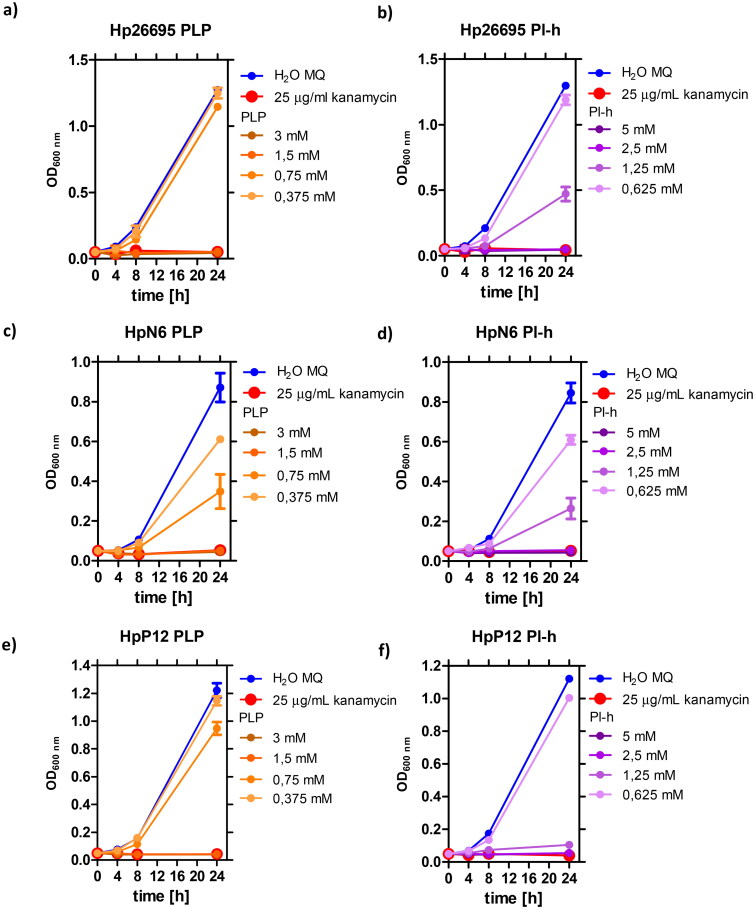
Figure 7.
Growth curves of H. pylori 26695 strain (a,b), N6 strain (c,d) and P12 strain (e,f), in the presence of various concentrations of PLP and PI-h. MIC values determined from these curves are shown in Table 4 and were also confirmed by the Christensen urease test as described in Materials and Methods section and shown on Figure 9 for the pair PI-h/strain 26695 as an example.

