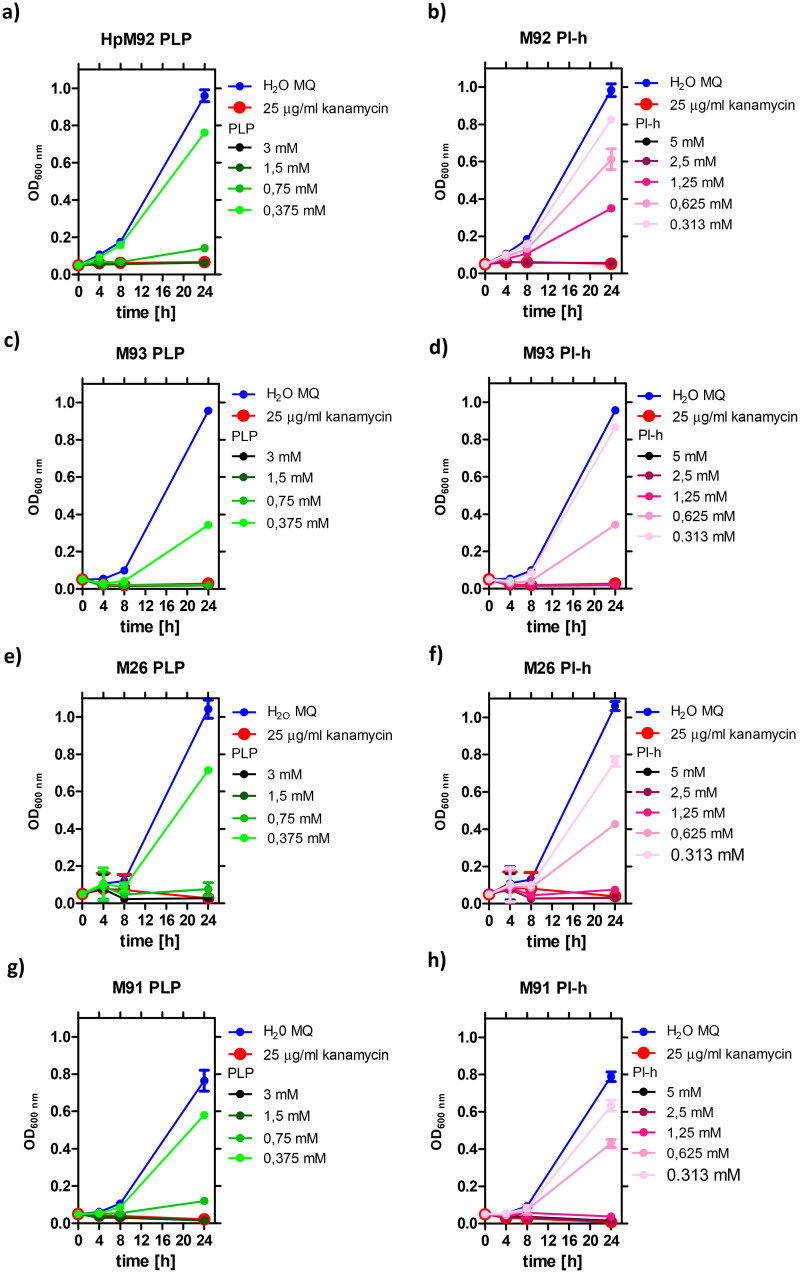
Figure 8.
Growth curves of H. pylori strain M92 resistant to clarithromycin (a,b), M93 resistant to metronidazole (c,d), and M26 (e,f) and M91 (g,h) resistant to both drugs, in the presence of various concentrations of PLP and PI-h. MIC values determined from these curves are shown in Table 4 and were also confirmed by the Christensen urease test as described in Materials and Methods section.

