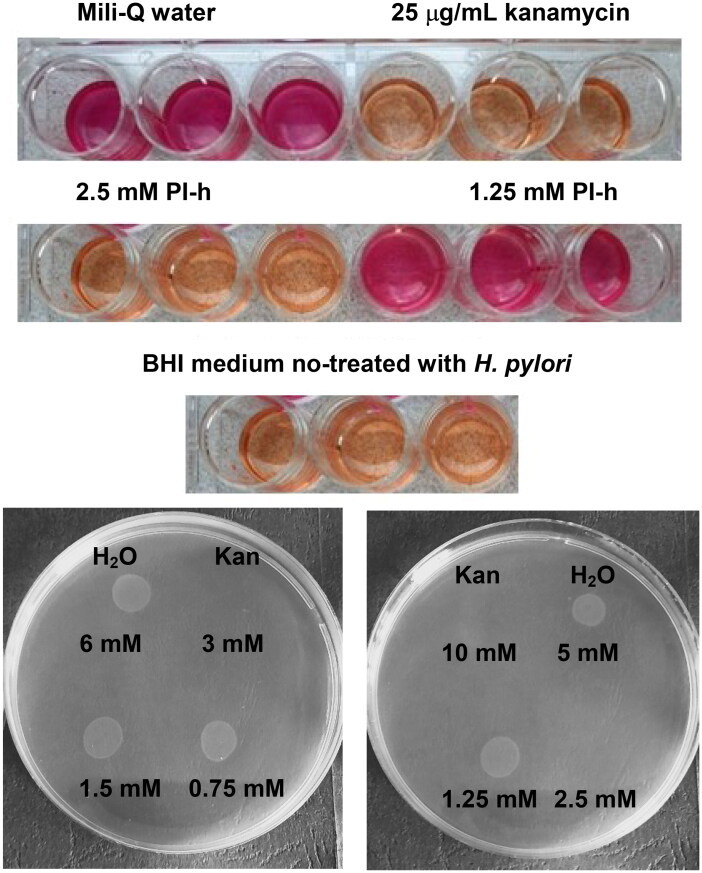
Figure 9.
Upper panel: example of the Christensen urease test, here for the pair PI-h/H. pylori strain 26695, confirming MIC = 2.5 mM for this pair obtained from the growth curves experiment (Figure 7 panel b). Kanamycin, 25 µg/mL served as a positive control, while water and BHI medium not treated with H. pylori, as negative controls. Lower panel: example of the MBC determining experiment, here for the PLP (left) and Pl-h (right) against H. pylori strain 26695, showing that MBC is 3 mM and 2.5 mM, respectively. Kan indicates a positive control (25 µg/ml of kanamycin).

