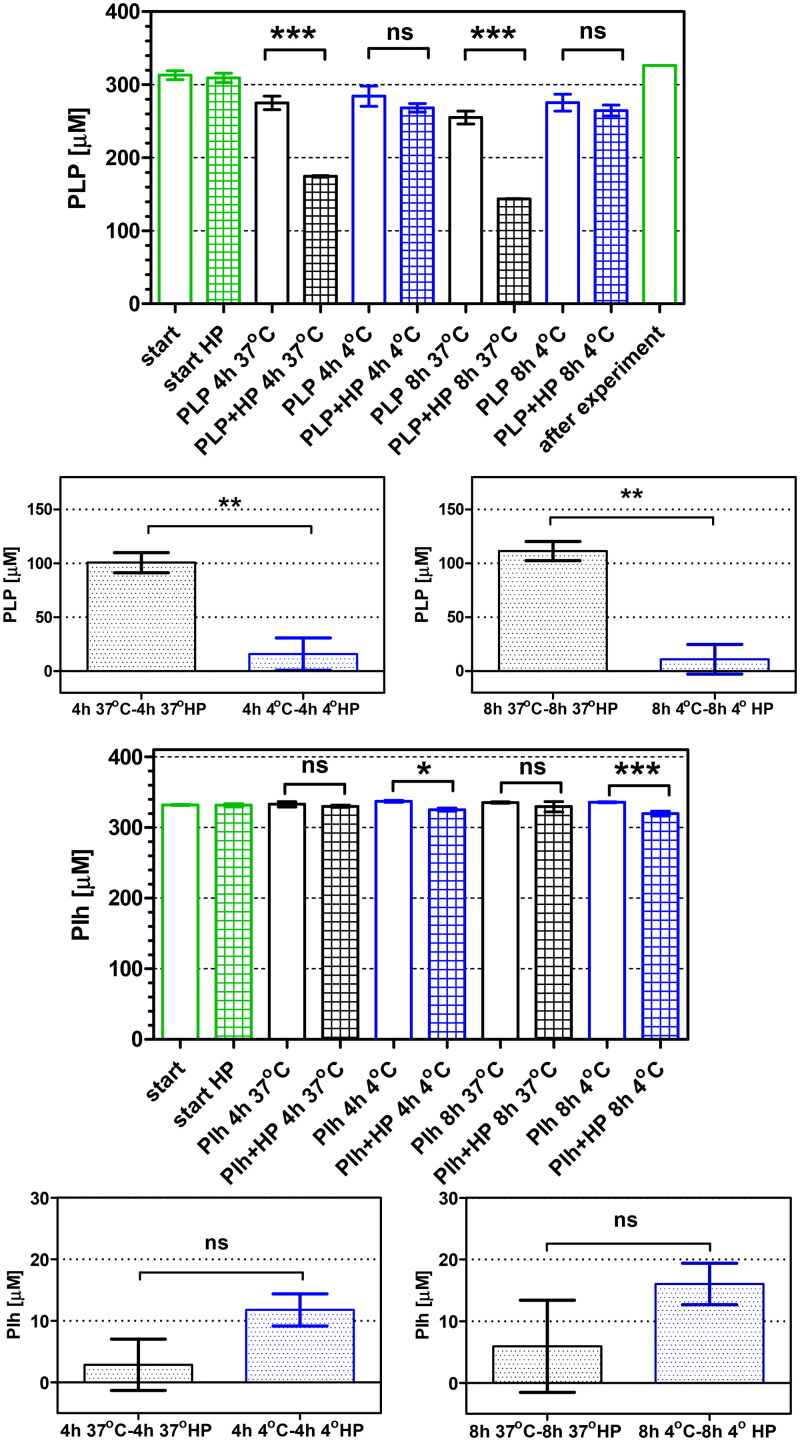
Figure 10.
Cellular uptake of PLP and Pi-h by the H. pylori 26695 strain after 4 h and 8 h of incubation, quantified by UV absorbance detection. Green bars show inhibitor concentration observed at the start of the incubation. Black and blue bars show data (extracellular inhibitor concentration) obtained for incubation at 37 °C and 4 °C, respectively. Open bars indicate inhibitor incubated in the F12 medium, while filled bars indicate inhibitor incubated in F12 medium containing H. pylori cells. Results are mean ± SEM, n = 3, **** p < 0.0001; *** p < 0.001; ** p < 0.01, * p < 0.05.

