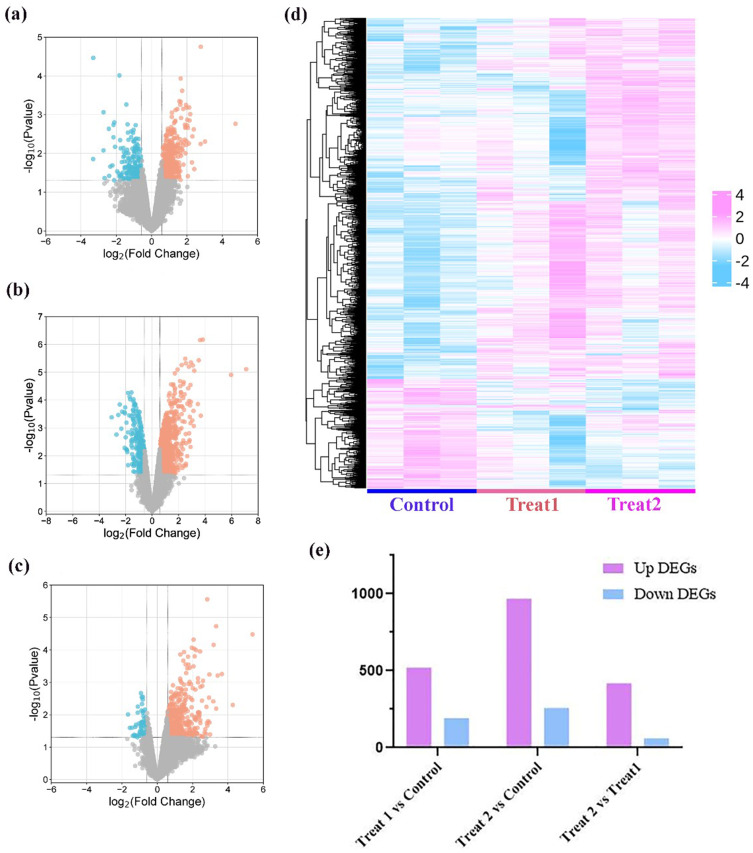
Figure 5.
Differential analysis of transcriptome sequencing. (a-c) Differential expression gene volcano map of (a) Treat 1 vs control, (b) Treat 2 vs control, (c) Treat 2 vs Treat 1; (d) Hierarchical heatmap analysis of differentially expressed genes of control, Treat 1, and Treat 2. (e) Up DEGs and down DEGs of Treat 1 vs control, Treat 2 vs control, Treat 2 vs Treat 1.

