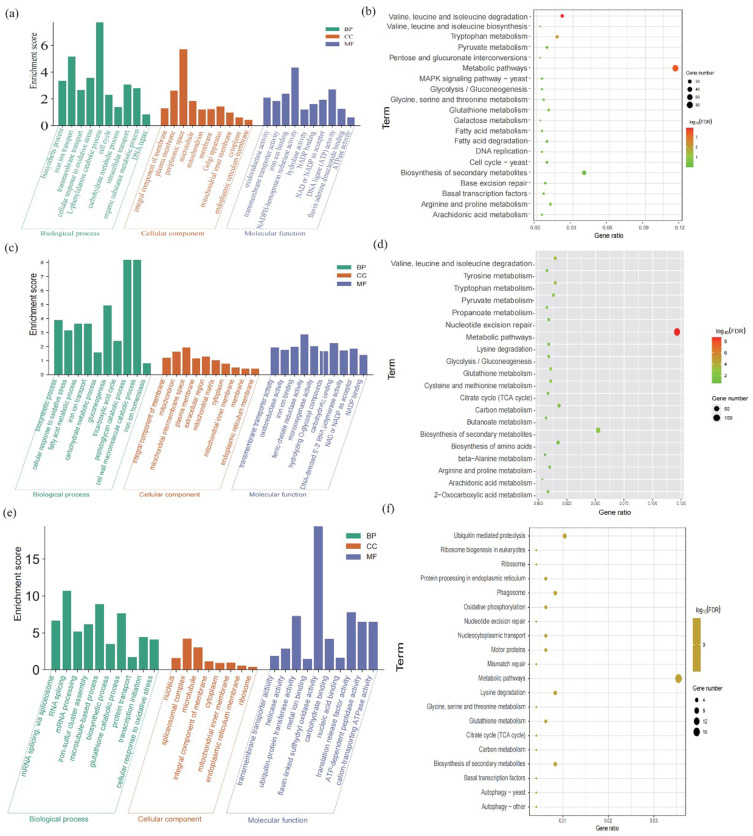
Figure 6.
Functional enrichment of DEGs. Biological processes (BPs), molecular functions (MFs), and cellular components (CCs) of (a) Treat 1 vs control, (c) Treat 2 vs control, (e) Treat 2 vs Treat 1. KEGG enrichment analysis of (b) Treat 1 vs control, (d) Treat 2 vs control, (f) Treat 2 vs Treat 1.

