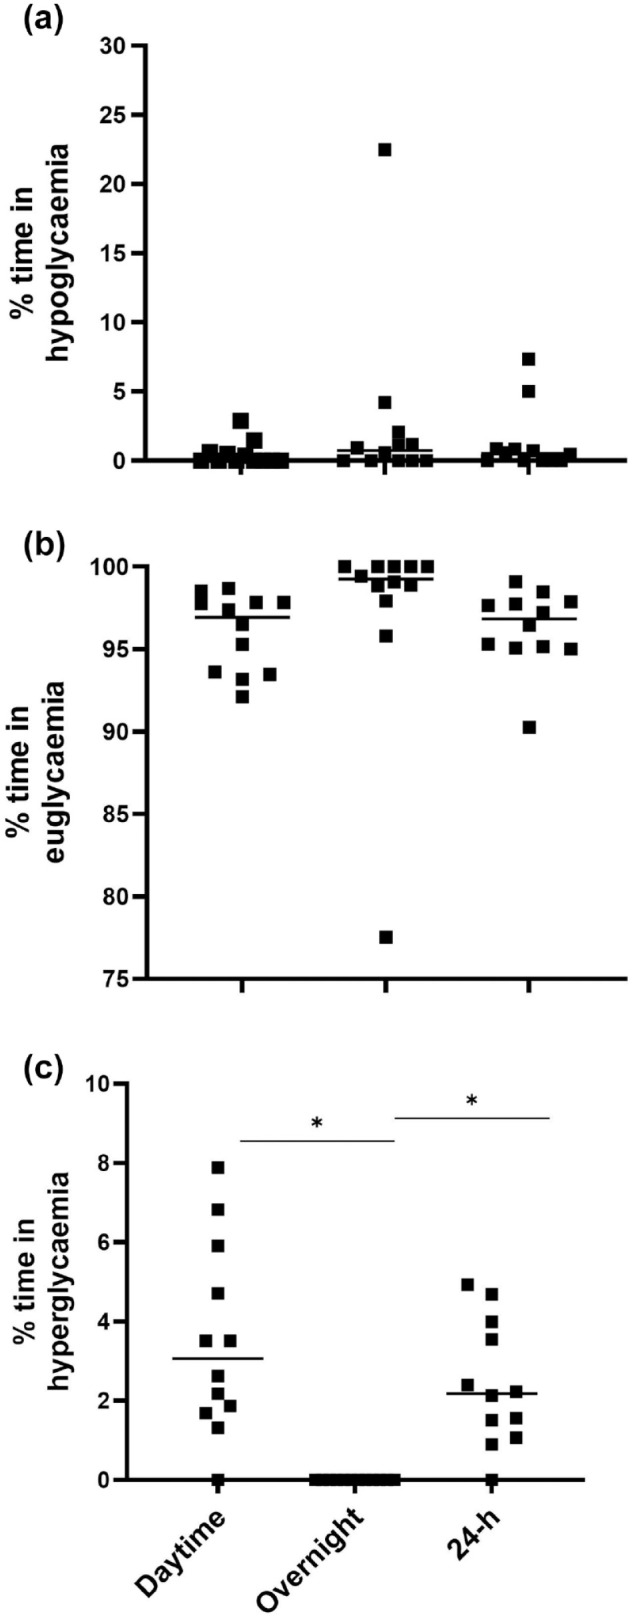
Figure 3.

Percent time spent in either (a) hypoglycemia (<72.0 mg/dL [< 4.0 mmol/L]), (b) euglycemia (72.0-144.0 mg/dL [4.0-8.0. mmol/L]), or (c) hyperglycemia (>144.0 mg/dL [> 8.0 mmol/L]) across all 8-d of the trial.
*Denotes a significant difference (P < .0030).
