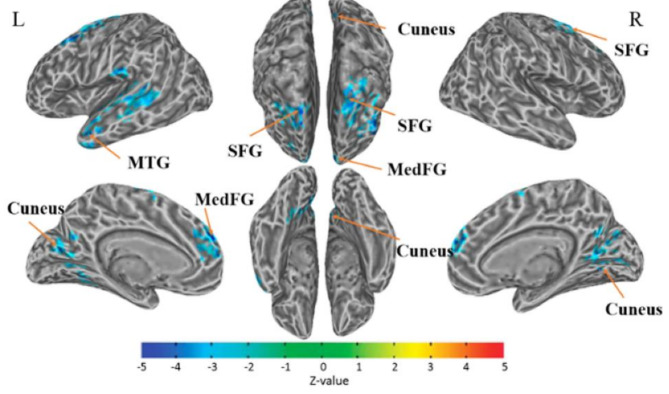
Fig. 3.
fMRI Detected Functional Connectivity Changes in Cancer Survivors. Demonstration of the lower connectivity areas with the anterior cingulate cortex (ACC) determined by the seed-based method. The color represents the degree of correlation (z-value) between functional connectivity strength. The altered connectivity areas included left superior frontal gyrus (L_SFG), left medial frontal gyrus (L_MedFG), left middle temporal gyrus (L_MTG), left cuneus, right cuneus, and right superior frontal gyrus (R_SFG). L = left hemisphere; R = right hemisphere. The threshold was set to P ≤ 0.05 (corrected with the Monte Carlo method). Adopted from Miao, et al. [103]

