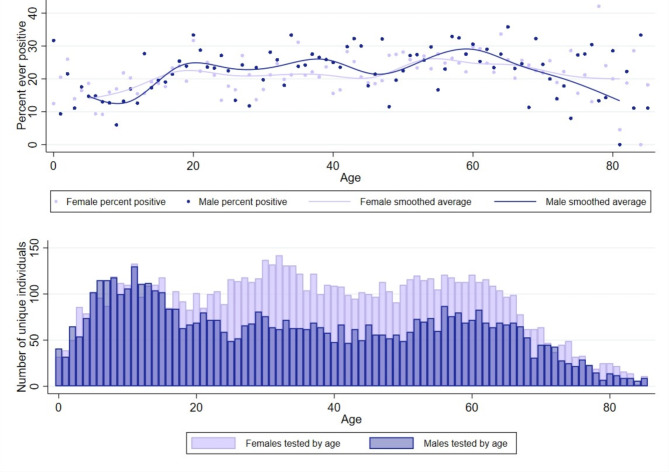
Fig. 4.
Ever positive and unique individuals by age and sex. (A) Percent of individuals who tested positive at least once during the study period. Each dot represents percent ever positive for each age year, by sex—light purple (female) and blue (male). Average ever positive over life course represented by median spline lines for each sex. (B) Bars represent total number of unique individuals that were tested by sex for each age year, light purple (female) and blue (male)

