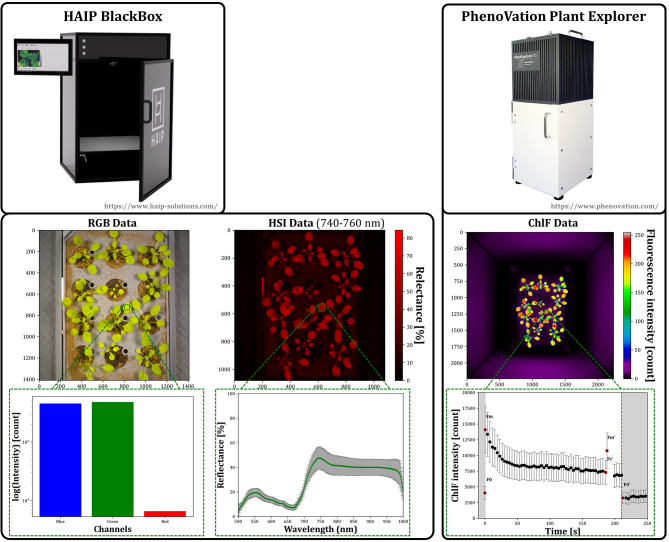
Fig. 2.
Hardware and output data of Multi-modal imaging of A. thaliana cultivated in modified PhenoWell®-plates. The upper row shows the two commercially available sensor systems (hyperspectral and chlorophyll fluorescence imager). The middle row displays exemplary output data of the used imaging sensor. The lower row shows the difference in the dimionsality of the output data of a subregion (green squares) ranging from 3 channels of RGB data, 250 spectral channels of hyperspectral camera and at least five raw/base fluorescence signals of the chlorophyll fluorescence imager (F0,Fm,Fm’,Fs’,F0’ colored red in chlorophyll fluorescence kinetic data)

