Figure 2.
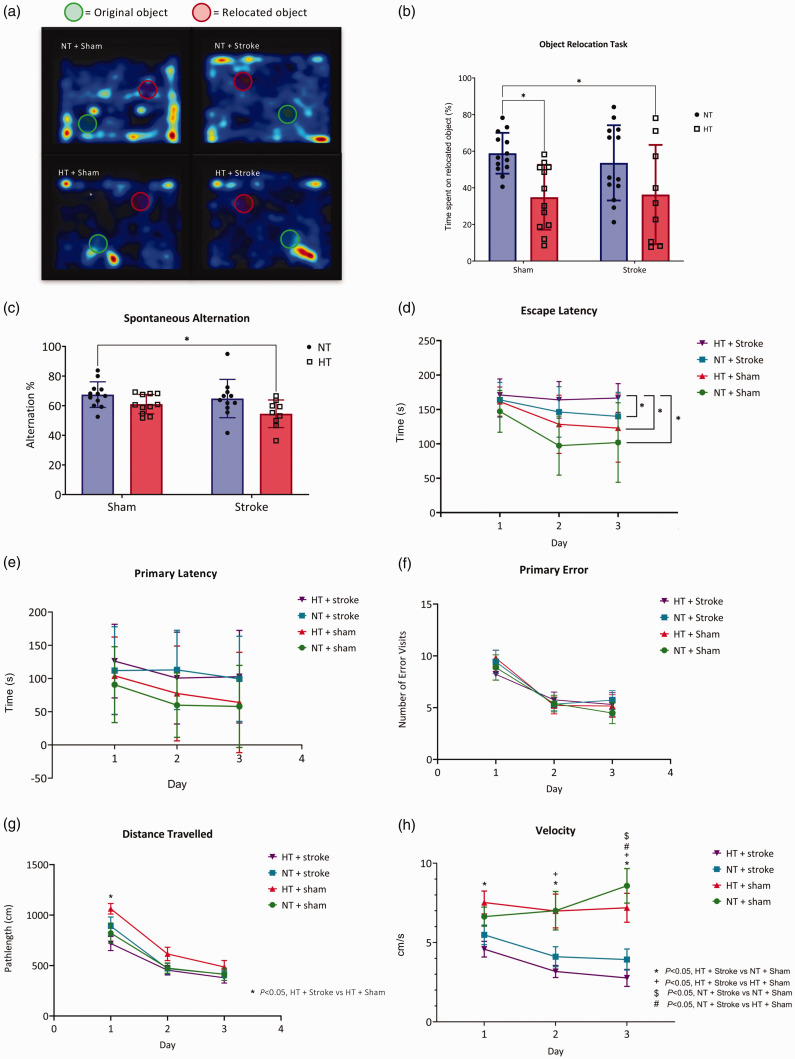
The assessment of memory and learning. (a) Representative heat maps of activity when performing the object relocation task with the location of the original and relocated object shown in mice undergoing the 14-day protocol. (b) Quantification of the % time spent interacting with the relocated object. (c) Spontaneous alternation test conducted using the Y maze in mice undergoing the 14-day protocol. The Barnes maze was performed in mice undergoing the 28-day protocol. (d) Escape latency, (e) primary latency (s), (f) primary error, (g) distance travelled (cm), and (h) velocity (cm/s) were measured across 3 days. (b) Data are presented as mean ± SD, n = 9–13/group, (c) and n = 9–12/group. (b and c) * = P < 0.05, two-way ANOVA mixed-effects with Tukey’s multiple comparisons test. (d–h) Data are presented as mean ± SD, n = 12–13/group. (d and f) * = P < 0.05, aligned ranked transformed ANOVA mixed-effects with Tukey’s multiple comparison test and (e, g and h) two-way ANOVA repeated-measures with Tukey’s multiple comparison test.

