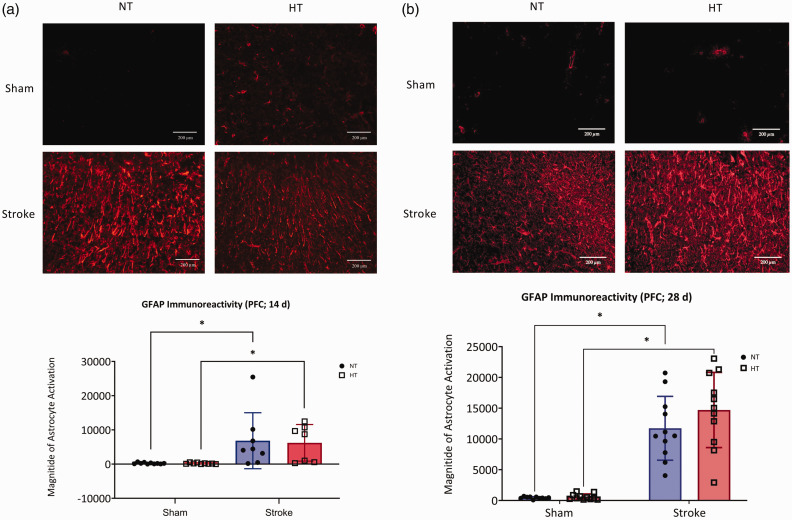
Figure 4.
Astrocyte reactivity. Representative photomicrographs (top) of GFAP immunoreactivity in the prefrontal cortex at (a) 14-day and (b) 28-day. Images were taken at 400X magnification, images were taken on the edge of the peri-infarct region and equivalent locations were then imaged in shams. Quantification of astrocyte activation across all groups (bottom) in the (a) 14-day and (b) 28-day protocol. Data are presented as mean ± SD, (a) n = 7–10/group and (b) n = 10–11/group, * indicates P < 0.05, analysis by (a) aligned ranked transformed ANOVA with Tukey’s multiple comparisons test and (b) two-way ANOVA with Tukey’s multiple comparisons test.

