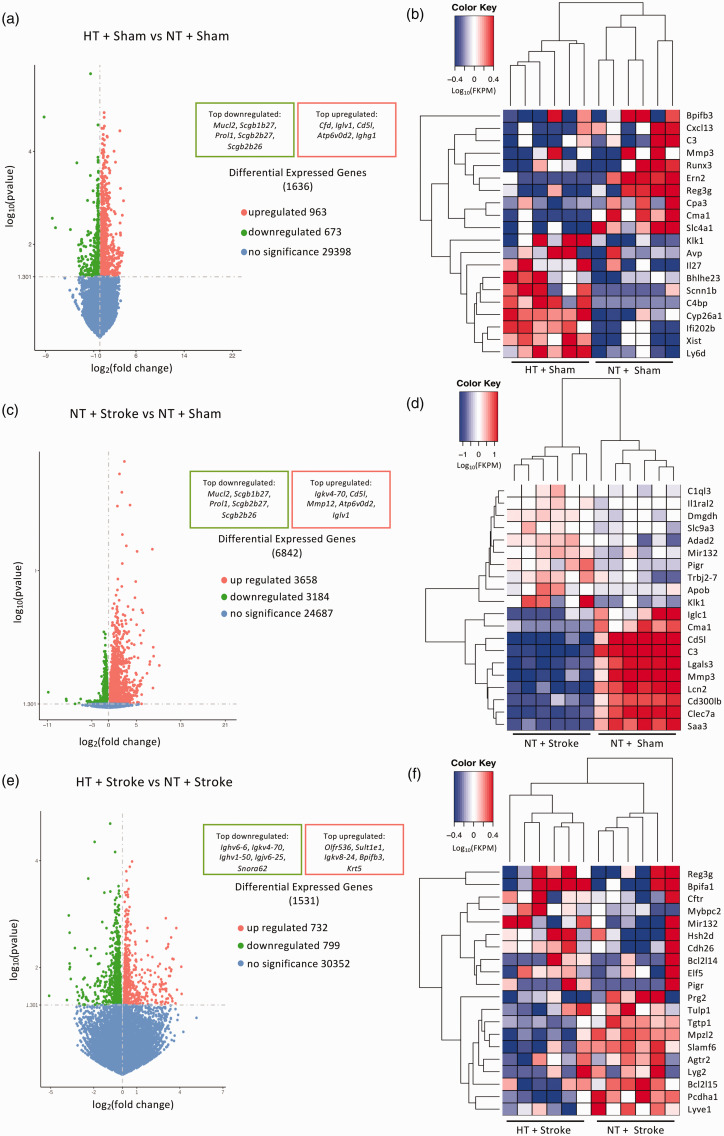
Figure 5.
Transcriptomic analysis of hypertensive and stroke brains within the prefrontal cortex. Volcano plots of the log10 adjusted p-value vs log2 fold change of differentially expressed genes in the (a) hypertensive (HT) + Sham vs normotensive (NT) + Sham, (c) NT + Stroke vs NT + Sham, and (e) HT + Stroke vs normotensive stroke NT + Stroke comparison. Heat map analysis of the top 10 up- and downregulated neuroinflammatory genes in the (b) HT + Sham vs NT + Sham, (d) NT + Stroke vs NT + Sham, and (f) HT + Stroke vs NT + Stroke comparison. Gene expression is shown as log10(FPKM +1) with a p-value threshold of <0.05.

