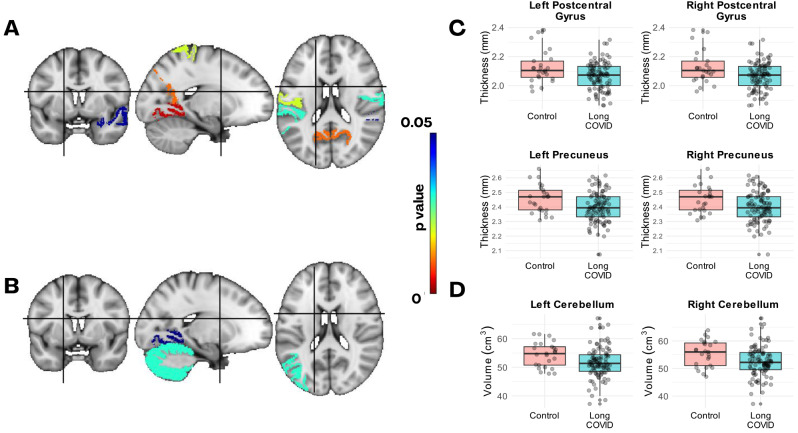
Fig. 3.
Regions of the Desikan-Killiany atlas with signs of atrophy in the LC group. Regions with differences between the LC and controls groups in their cortical thickness (A) and volume (B) are highlighted with a colorbar as a function of the raw p-value (uncorrected for multiple comparisons). C) Boxplots of the cortical thickness of the left and right postcentral gyrus and precuneus for the control and LC groups (shown in A). D) Boxplots of left and right cerebellum grey matter volume. On each box, the central mark is the median, and the edges of the box are the 25th and 75th percentiles

