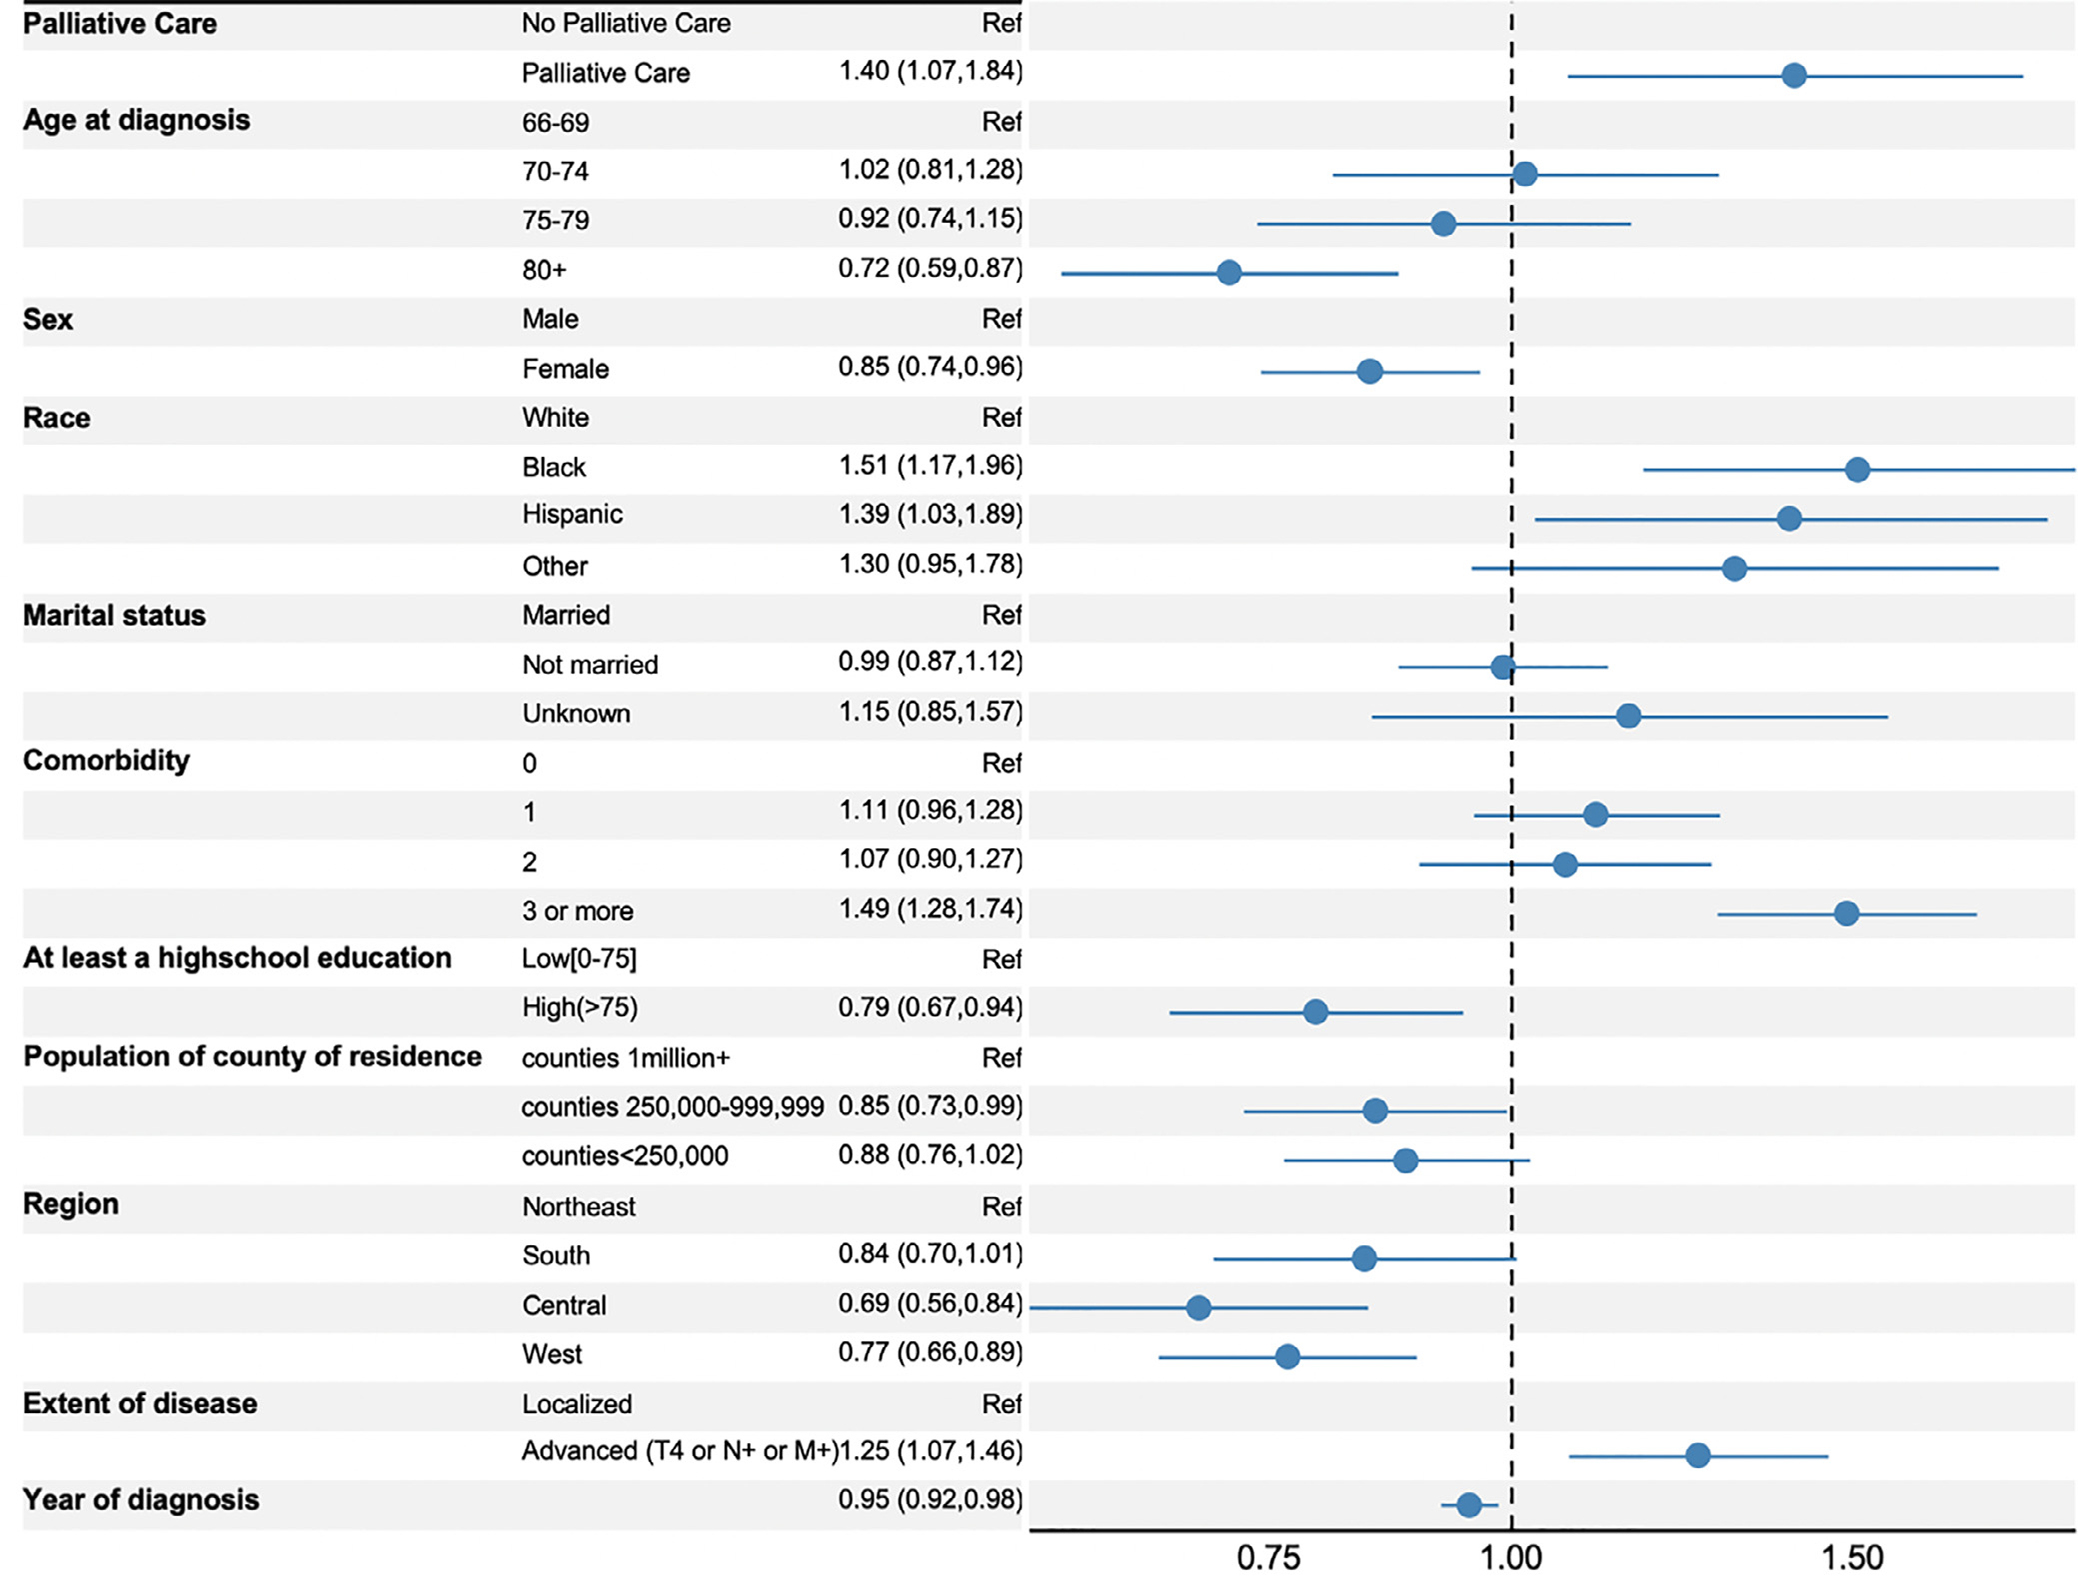
Fig. 1.

Forrest plot of adjusted odds ratios of receiving any high-intensity end-of-life care. Statistics presented are odds ratios with 95% confidence intervals. Multivariable analysis used a generalized linear mixed model with logit link. Estimates are adjusted for all covariates.
