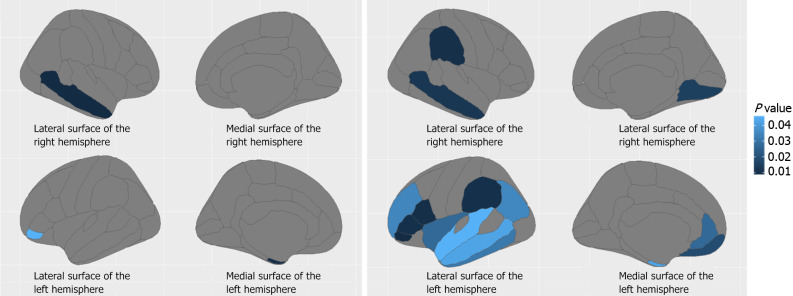
Figure 2.
Brain regions (blue area) where the cortical thickness was significantly correlated with intercellular adhesion molecule-1 in the control and cerebral small vessel disease groups. A: Regions where cortical thickness correlated with intercellular adhesion molecule-1 (ICAM-1) in healthy control group (independent sample t-test); B: Regions where cortical thickness correlated with ICAM-1 in cerebral small vessel disease group (independent sample t-test).

