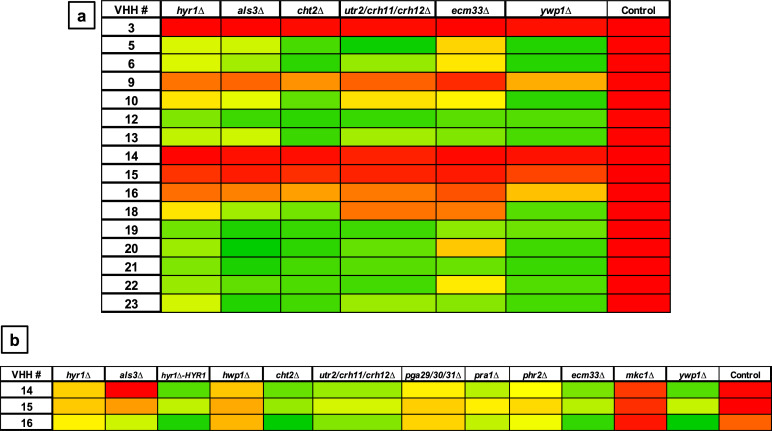
Fig 4.
Whole-cell ELISAs with cell wall mutants and selected VHHs. The antibodies were tested against formaldehyde-inactivated cells, and the absorbance was measured at 490 nm (subtracting the background 655 nm) for yeast cells (a) and hyphae (b). Control is SC5314. The color code for the absorbance was set on the background signal given by the control (no cells). Zero percent indicates the signal intensity of the negative controls (red), and 100%, the highest signal in the plate (green). The measurements were the average of two technical replicates.

