
Figure 2.
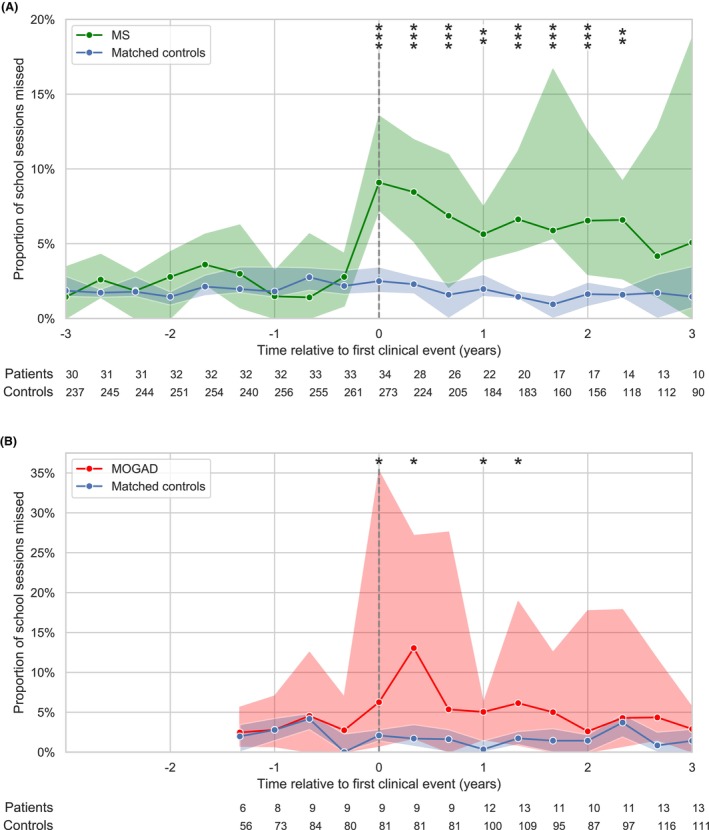
School absence before and after clinical onset of MS and MOGAD. The median proportion of sessions absent per school term in MS (A: green) and MOGAD (B: red) compared to matched controls (blue). Patients' time series were centred on the term when their first clinical event occurred (vertical dashed line). Shaded regions indicate the 95% CI for the group median at each timepoint. The group sizes at each timepoint are shown below; timepoints with data available in ≤5 patients were not analysed. Asterisks indicate statistical significance (false discovery rate corrected p‐values) at each timepoint (*P < 0.05, **P < 0.01 and ***P < 0.001). MS, multiple sclerosis; MOGAD, myelin oligodendrocyte glycoprotein antibody disease.