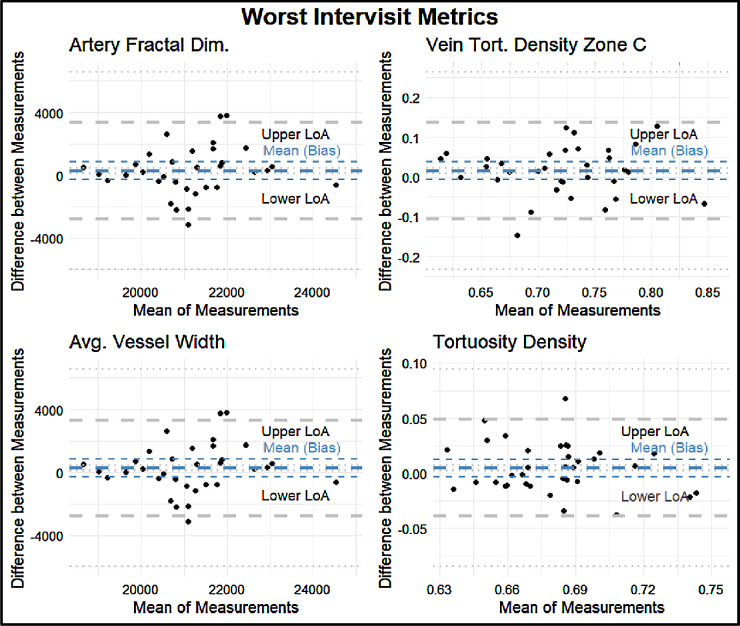
Figure 6.
Bland–Altman plots for the four metrics with the lowest retest reliability as assessed by Spearman correlation: artery fractal dimension, vein tortuosity density in Zone C, average vessel width, and tortuosity density. The thick blue line indicates the means (bias) of the measurements. The thick gray lines indicate the upper and lower LoA. The thin lines indicate the 95% CIs for the means (bias) and LoA.

