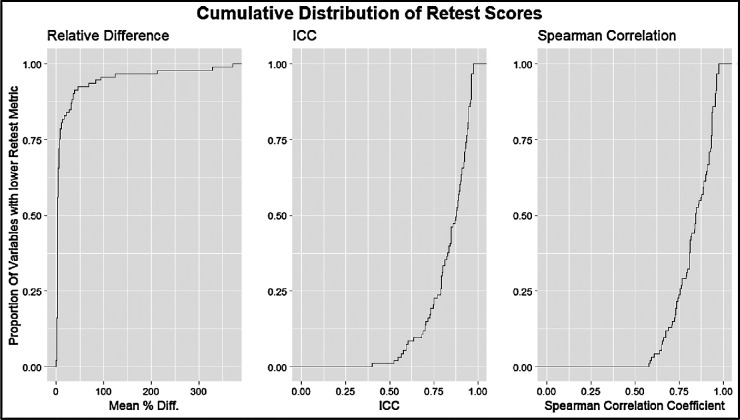
Figure 7.
Cumulative distribution curves of retest quality metrics for the intravisit group. The y-axis represents the proportion of measured variables with lower retest. The x-axis from left to right shows the mean percentage difference between test and retest metrics of two-way, single-unit agreement ICC and Pearson correlation coefficient.

