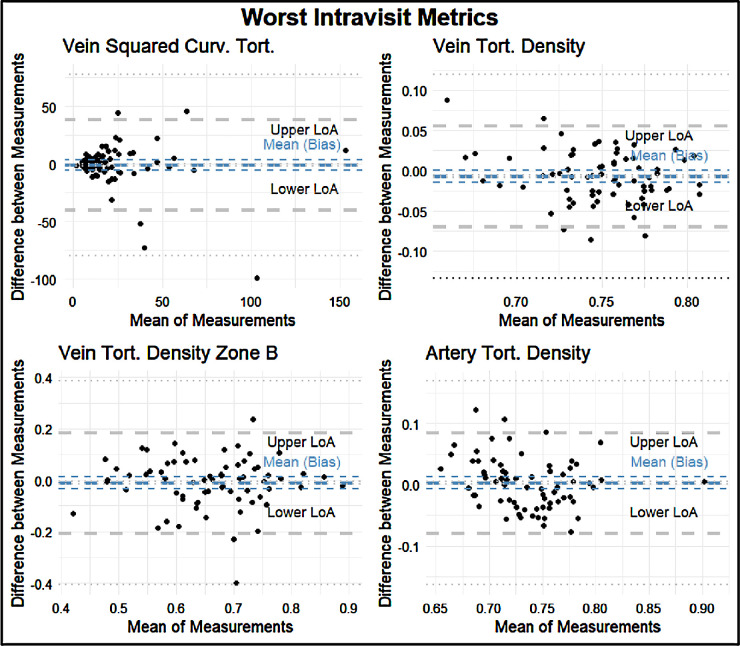
Figure 9.
Bland–Altman plots of the four worst metrics in terms of retest reliability by Spearman correlation: artery distance tortuosity, vein tortuosity density, vein tortuosity density of Zone B, and artery tortuosity density. The plots feature the following: The thick blue line indicates the means (bias) of the measurements. The thick gray lines indicate the upper and lower LoA. The thin lines indicate the 95% CIs for the means (bias) and LoA.

