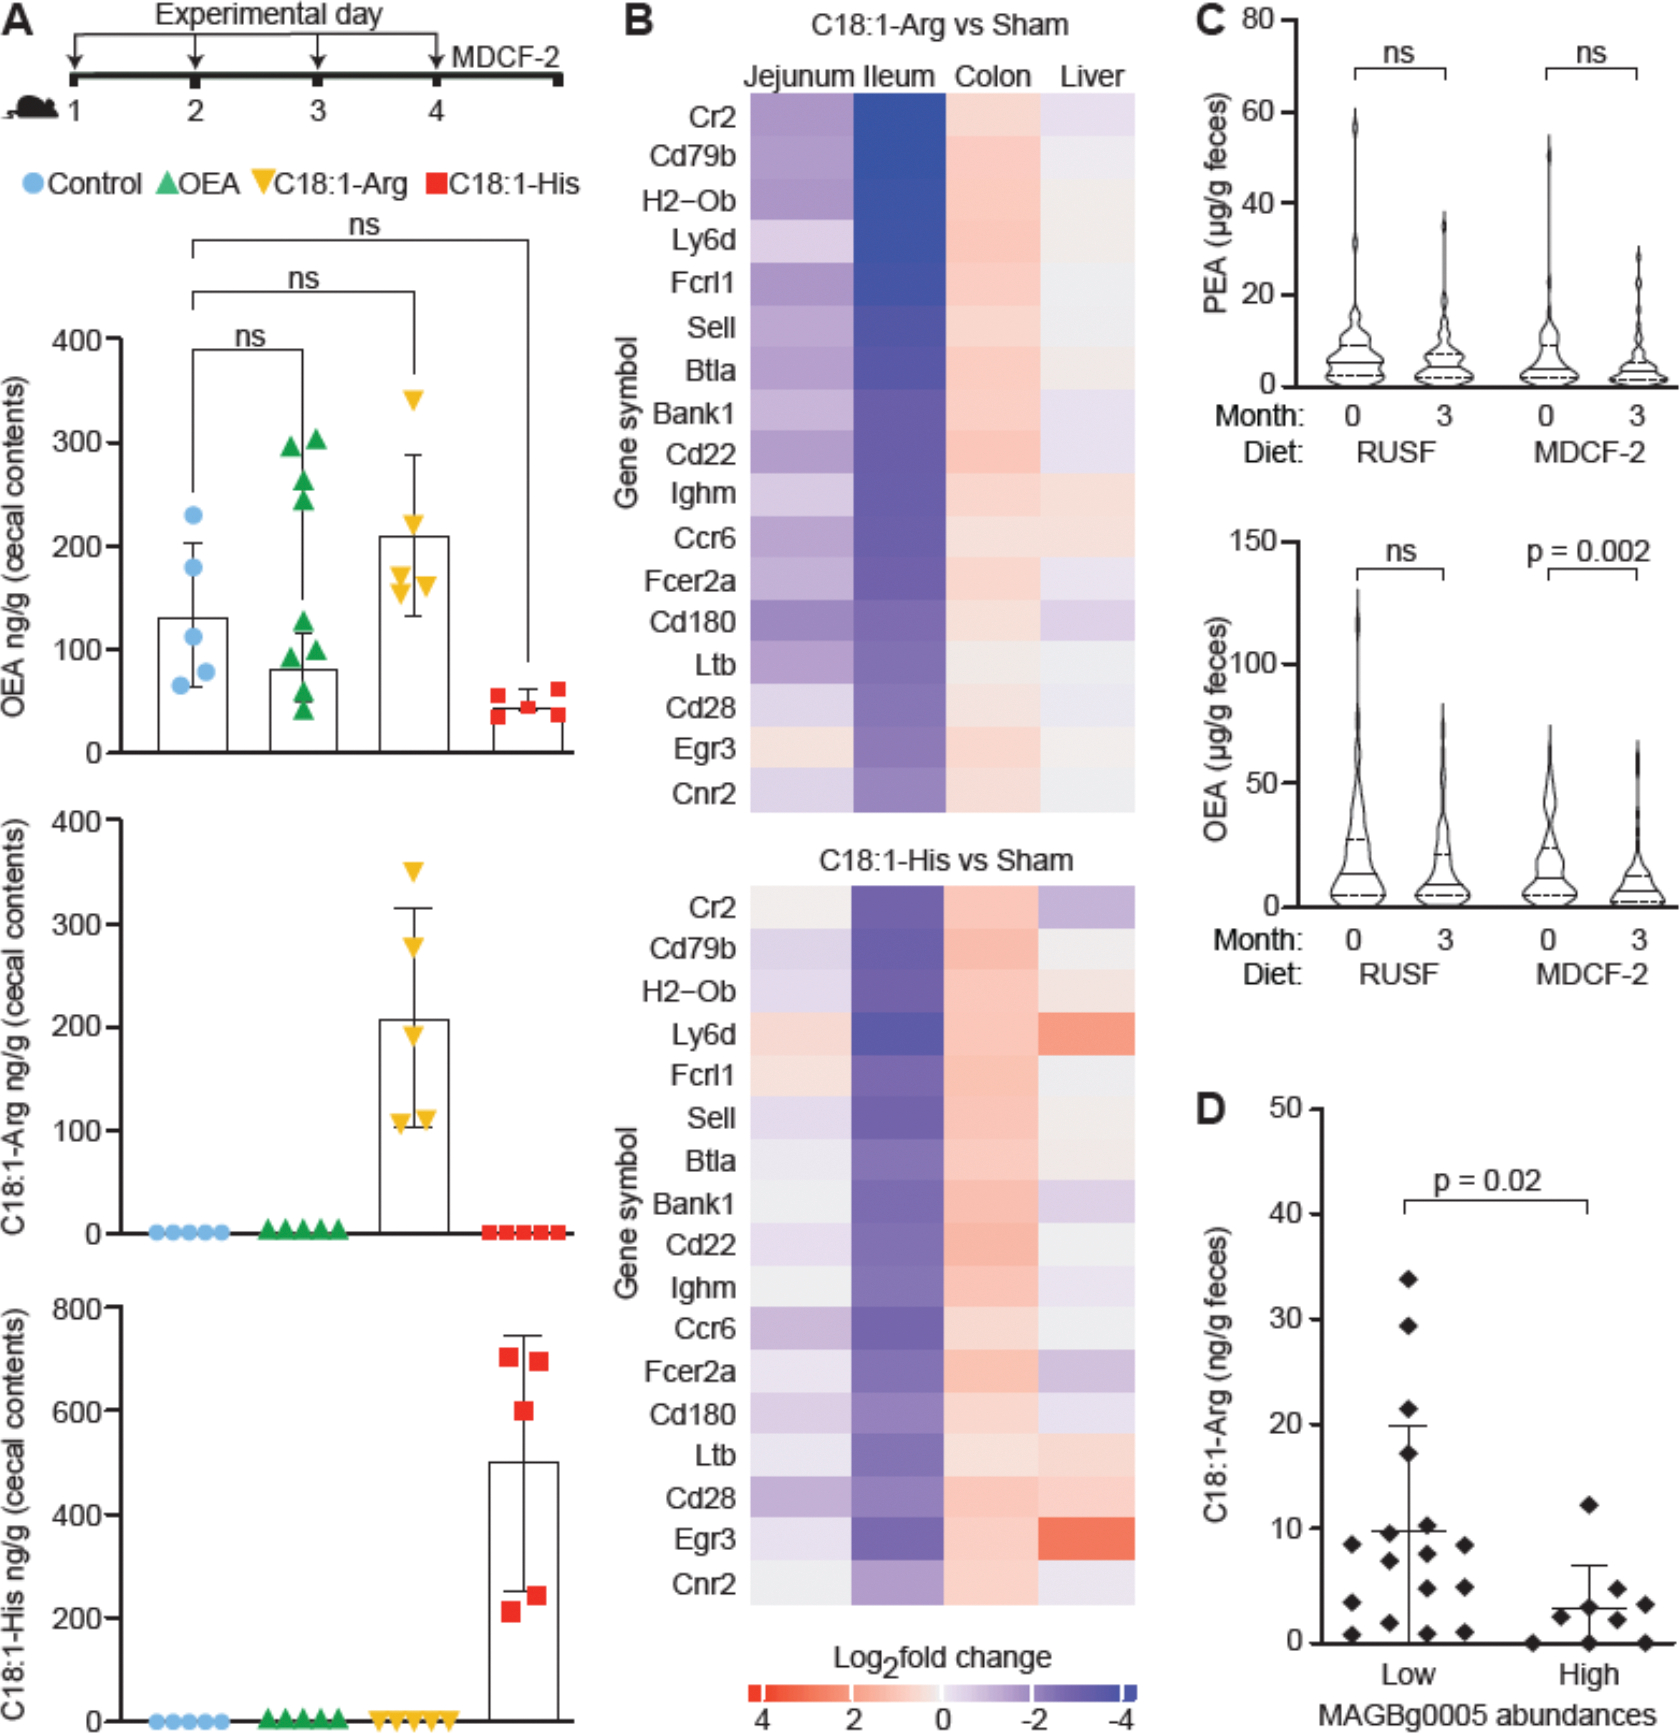
Figure 4. Host effects of F. prausnitzii FAAH synthetic products and correlation between F. prausnitzii FAAH abundance and fecal levels of N-acyl amides in undernourished children.

(A) Experimental design. Groups of 4–5-week-old male germ-free animals received the indicated metabolite by oral gavage on experimental days 1, 2, 3, and 4 (n=5 mice/treatment group). Cecal levels of OEA, C18:1-Arg, and C18:1-His in germ-free mice were measured using LC-QqQ-MS. Each dot represents a sample from a mouse in the indicated treatment group. Mean values ± SD are plotted. NS, not significant (1-way ANOVA followed by post-hoc Tukey’s test). (B) Heatmap of log2-fold change in levels of significantly differentially expressed transcripts (rows) that contribute to the 46 pathways (table S8C) whose expression was significantly enriched in both the ileum and jejunum upon treatment with C18:1-Arg and C18:1-His. (C) Fecal levels of OEA and PEA in children (n=117) prior to- and 3-months after initiation of RUSF or MDCF-2 treatment. Data are visualized using violin plots; median values for each analyte are shown. p-values shown were based on Wilcoxon matched-pairs signed rank test. NS, not significant. (D) Fecal levels of C18:1-Arg in samples obtained from the ‘low MAGBg0005 group’ and ‘high MAGBg0005 group’. The p-value was calculated using a Mann-Whitney test.
