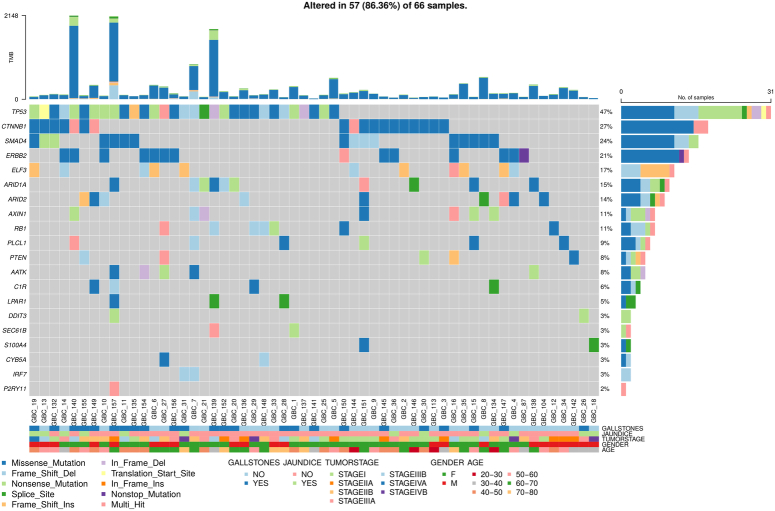
Figure 2.
Oncoplot illustrating the top genes with potential driver variants, correlated with sample, age, sex, tumor stage, gallstone presence, and jaundice status in 57 GBC samples. Each column represents a distinct GBC sample, while each row denotes a specific gene. Colored squares indicate altered genes, whereas grey squares signify non-mutated genes. Variants are color-coded according to their mutation types. Genes marked as "Multi_Hit" denote those with multiple mutations within the same sample. The barplot at the top shows the tumor mutation burden (TMB), with colors representing different mutation types.

