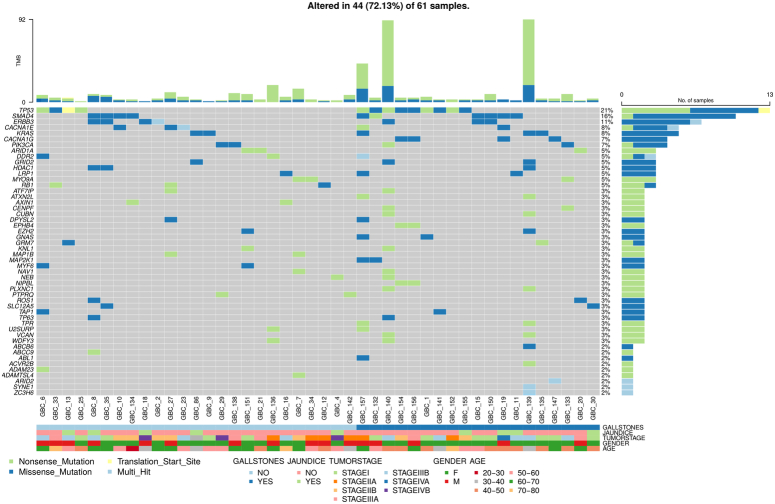
Figure 3.
Oncoplot showing pathogenic gene variants and their distribution among 44 out of 61 gallbladder cancer (GBC) samples. These genes were selected based on ACMG classification, highlighting pathogenic and likely pathogenic variants. The gene variants are correlated with clinical features, including age, sex, tumor stage, gallstone, and jaundice status. Each column represents a GBC sample, and each row corresponds to a specific gene. Colored squares indicate mutated genes, while grey squares represent non-mutated genes. Different mutation types are distinguished by various colors. Genes marked as "Multi_Hit" contain more than one mutation in the same sample. The barplot at the top displays tumor mutation burden (TMB), color-coded by mutation type, while the barplot on the right shows the number of patients with mutations in each gene.

